Our Site uses cookies to improve your experience on our website. For more details, please read our Cookie Policy.
By closing this message or starting to navigate on this website, you agree to our use of cookies.
Our Site uses cookies to improve your experience on our website. For more details, please read our Cookie Policy.
By closing this message or starting to navigate on this website, you agree to our use of cookies.


Contact
Mitsui Fudosan Realty can provide a wide range of real estate services on both investment and residential properties.
Please feel free to give us a call or contact with mail inquiry.
Phone
- China400-120-1319
- HongKong800-93-3060
- Taiwan00801-81-2728
- Japan0120-923-431
- Other Regions+81-3-6758-4072

Properties and Trends in Contracts Concluded in the Overall Tokyo Bay Area
Properties and Trends in Contracts Concluded in the Overall Tokyo Bay Area
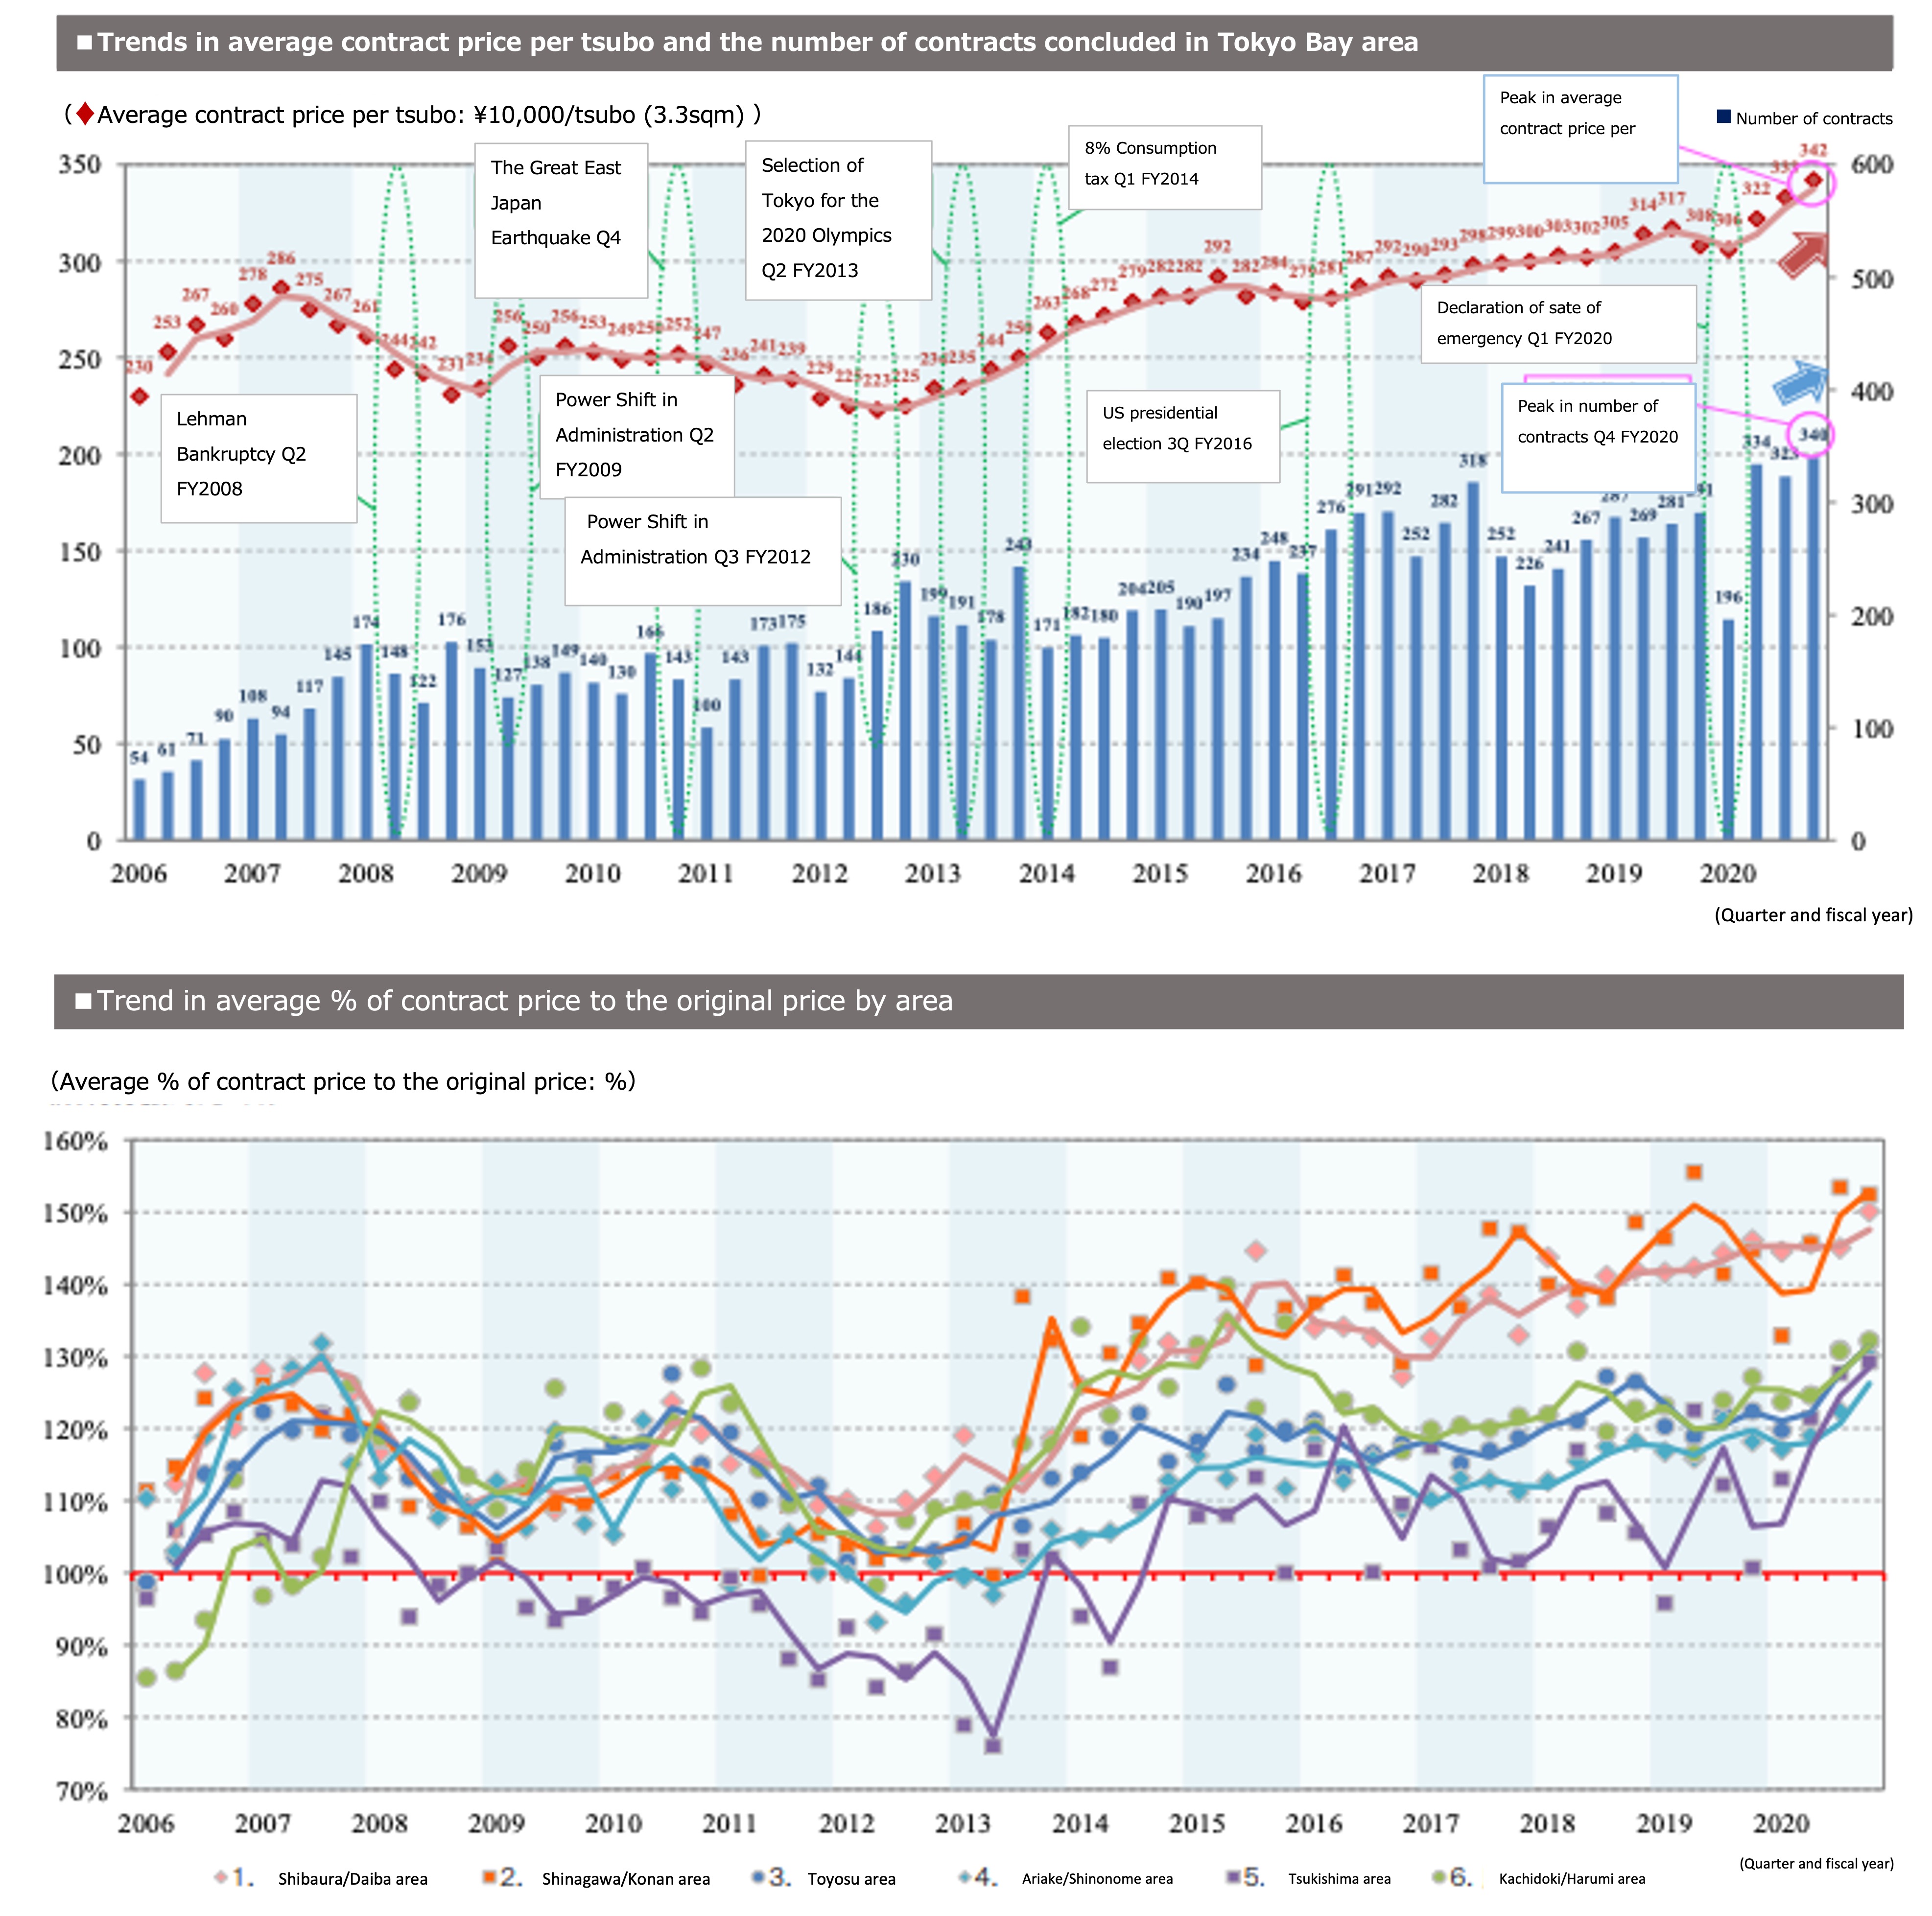
The upper graph provides an objective comparison of trends in number of contracts concluded and the average contract price per tsubo (3.31 sqm) for Tokyo Bay area (all six areas from which condominium were sampled) with important economic events for the same period. In the lower graph, we see the trend in average % of contract price to original price by area. If we look at the trend for the entire Tokyo Bay area in the period under review (upper graph), we see that the number of contracts concluded increased from the previous period from 322 to 340, while the average contract price per tsubo rose from ¥3.33 million to ¥3.42 million. Both of these figures are at their highest levels since tabulation began in 2006.
Turning to results by area, we see that four areas notched their highest levels on the average contract price per tsubo since tabulation began: Shibaura/Daiba area, Toyosu area, Ariake/Shinonome area and Tsukishima area. In Shibaura/Daiba area, the price has hit a record high from the previous period in a row.
The area that recorded the highest number of contracts concluded was Kachidoki/Harumi area. In average % of contract price to original price, the figure for the entire Tokyo Bay area was 135.9%. This figure has been the highest since tabulation began, from the previous period in a row.
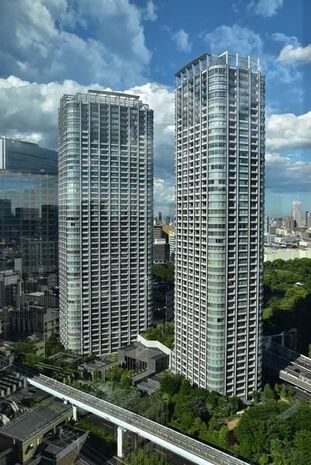
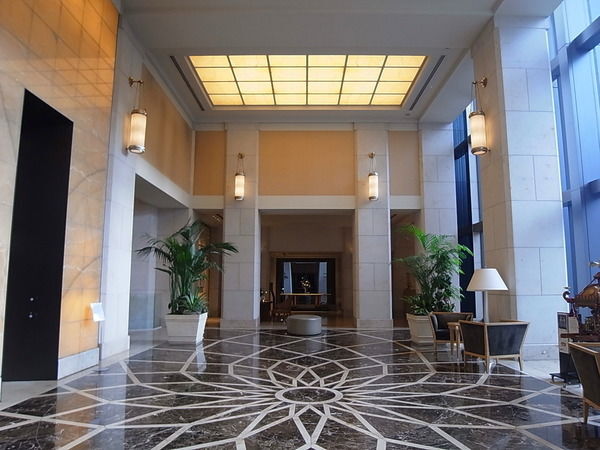
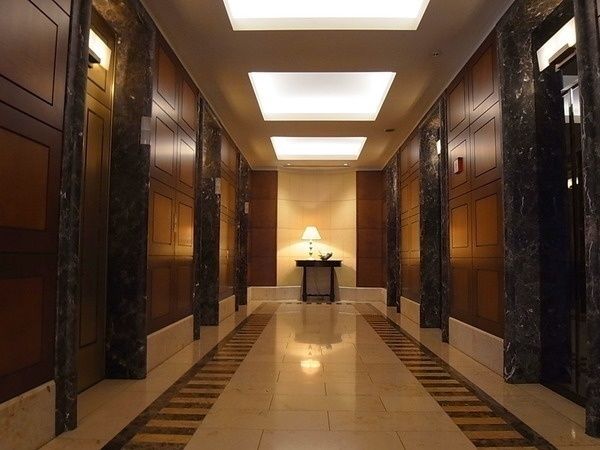
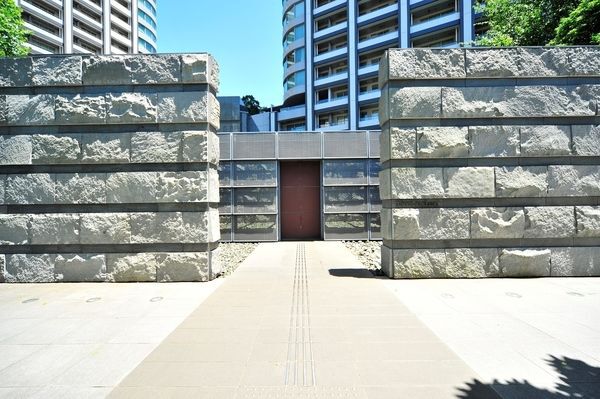
If you’re interested in properties in Tokyo Bay Area such as these, please have a look at ”Tokyo TWIN Park”.