Our Site uses cookies to improve your experience on our website. For more details, please read our Cookie Policy.
By closing this message or starting to navigate on this website, you agree to our use of cookies.
Our Site uses cookies to improve your experience on our website. For more details, please read our Cookie Policy.
By closing this message or starting to navigate on this website, you agree to our use of cookies.


Contact
Mitsui Fudosan Realty can provide a wide range of real estate services on both investment and residential properties.
Please feel free to give us a call or contact with mail inquiry.
Phone
- China400-120-1319
- HongKong800-93-3060
- Taiwan00801-81-2728
- Japan0120-923-431
- Other Regions+81-3-6758-4072

Investment Real Estate Market Report | 3Q FY 2021

Foreword
Thank you very much for your continued support and business.
We, at Mitsui Fudosan Realty, have been providing a broad range of services in order for our valued clients to make the "Best Use" of precious assets, and attentive consultation about concerns and worries clients have with respect to assets in various conditions, not only through brokerage of business and investment properties but also by helping clients to utilize assets effectively for such purposes as estate and tax planning.
As part of these efforts, we prepare an "Investment Real Estate Market Report" for reference to help clients grasp the situation affecting real estate holdings. Since the investment real estate market is susceptible to external factors such as economic trends, an objective point of view is essential to understand the current market conditions. It is our great pleasure if this report is instrumental for readers to develop asset building strategies.
We will continue striving to deliver long-term support through development, implementation, and follow-up of plans that will satisfy clients, meet demands of each client on a "one to one" basis by making the most of professional expertise and experience gained over the years, and prove worthy of clients' trust.
Please feel free to contact us at the office below with any comments or requests concerning this report, or any matters related to real estate assets.
We look forward to opportunities to serve you soon.
Mitsui Fudosan Realty Co., Ltd.
Solution Business Division
■Toll-free Number: 0120-321-376
■Hours: 9:30 am - 6:00 pm Closed Saturdays, Sundays, and holidays
■3-2-5, Kasumigaseki, Chiyoda-ku, Tokyo 100-6019, Japan
We, at Solution Business Division of Mitsui Fudosan Realty Co., Ltd., have been producing a "Investment Real Estate Market Report" to serve as an aid to hopefully assisting our valued clients formulate a medium-to long term asset building plan.
Please also take a look at our website, which is full of useful information such as properties for sale, various consultation services, and articles by real estate experts.
Areas subject to collection of data
Tokyo Central submarket: Minato-ku, Chiyoda-ku, Chuo-ku, Shibuya-ku, Shinjuku-ku, and Bunkyo-ku
Tokyo South submarket: Shinagawa-ku, Meguro-ku, Setagaya-ku, and Ota-ku
Tokyo North / West submarket: Suginami-ku, Nakano-ku, Nerima-ku, Toshima-ku, Itabashi-ku, Kita-ku, and Taito-ku
Tokyo East submarket: Koto-ku, Sumida-ku, Arakawa-ku, Edogawa-ku, Katsushika-ku, and Adachi-ku
Yokohama / Kawasaki region: Yokohama city and Kawasaki city
Detailed descriptions
Pick Up Area: For investment real estate, trends in the average gross yields on contract price and initial asking price, together with the number of closed contracts by submarkets are represented in the graph. The details of the transition of actual market value and properties both for sale and sold in certain neighborhoods are also shown.
Market Overview: As an overview of all the submarkets, the trend from the past to this quarter is available. Trends in the average gross yields based on contract price and initial asking price together with the number of closed contracts by area are shown for comparison.
Data Source: Information is extracted from the database containing properties offered for sale and contracts concluded through Mitsui Fudosan Realty Network (En-bloc condominiums / office buildings / apartment buildings).
- Number of Transactions & Average Gross Yield on Contract Price: Number of contracts closed in a quarter (three months) and average gross yield of them (including estimated values)
- Average Gross Yield on Initial Asking Price: Quarterly average gross yield of closed contracts based on their asking price initially quoted
*Figures in each chart represent indices based on values for 1Q / FY2012 set at 100.
(Average Gross Yield on Contract Price is shown as an index to Average Gross Yield on Initial Asking Price for 1Q / FY 2012 set at 100.)
[Note] The historical data may be revised subsequently due to maintenance carried out from time to time, such as adding newly acquired data.
Pick Up Area -Tokyo Central submarket-
(*)Tokyo Central submarket: Minato-ku, Chiyoda-ku, Chuo-ku, Shibuya-ku, Shinjuku-ku, and Bunkyo-ku
◆Movements by Quarter: Average Gross Yield on Contract Price / Average Gross Yield on Initial Asking Price / Number of Transactions
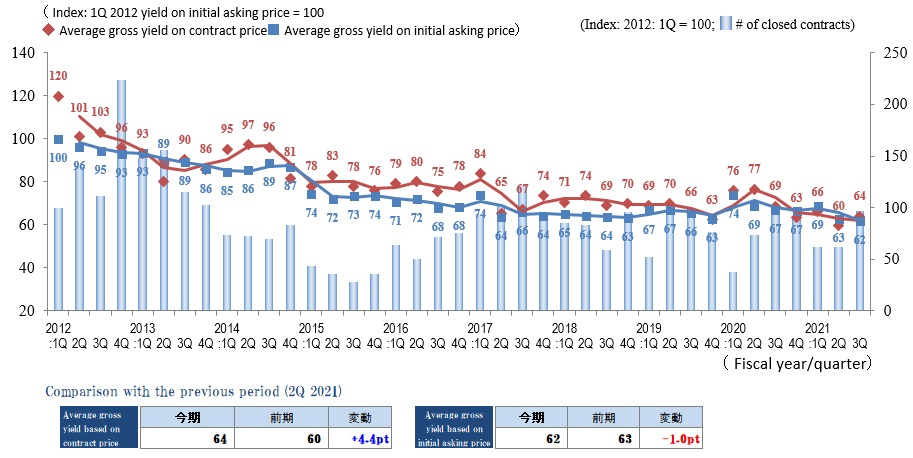
◆Brokered Transactions of Investment Real Estate in the Submarket
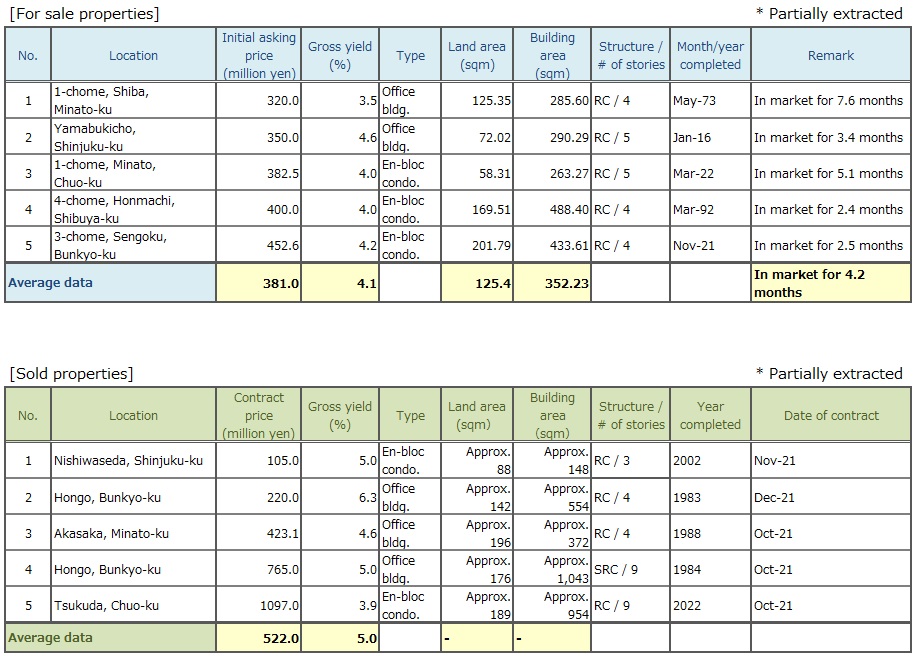
Index of Average Gross Yield on Initial Asking Price in 3Q / FY 2021 fell by 1.0 pt. QoQ to 62.On the other hand, index of Average Gross Yield on Contract Price went up by 4.4 pt. (price came down) QoQ to 64.Unusual phenomenon where Average Gross Yield on Contract Price falls below Average Gross Yield on Initial Asking Price has disappeared for the first time in a year. However, the level of these yields are so low that Tokyo Central submarket is deemed to be hot still.
Asking prices are rising on average due to sellers' confidence that there is a brisk investors' demand for assets in the central submarket. At the same time, there are certain number of sellers who have accepted discounts from asking prices in order to avoid protracted marketing period, pulling contract prices downward on average. So they must be thinking either 'Now is the time to sell.' or 'Better sell sooner than later.' As far as investors are concerned, they keep vigorously scrutinizing assets to buy and assets not to buy. So the "gap" between prime properties and others are widening. Sellers may need to make a sober judgment to find a point of compromise.
Although it appears that Tokyo Central submarket has remained strong from this survey, interest rate hikes and QE tapering in the US and elsewhere may have an impact on economy, interest rate trends, and the property market here. It will be necessary to keep a close eye on the market and see if the increase in Average Gross Yield on Contract Price this quarter marks a turning point in Tokyo Central submarket, which is sensitive to the economic conditions.
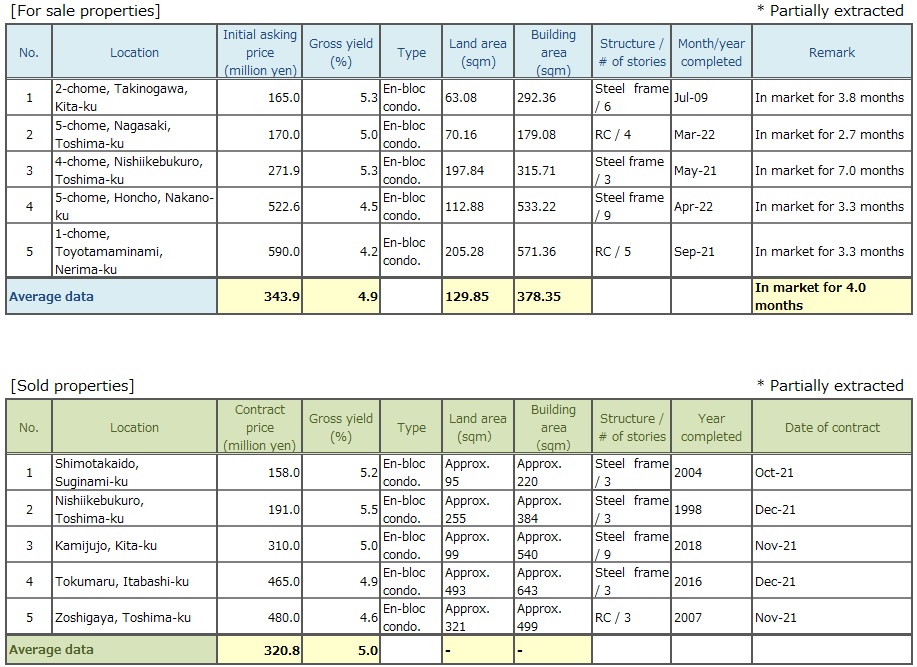
Pick Up Area -Tokyo South submarket-
(*) Tokyo South submarket: Shinagawa-ku, Meguro-ku, Setagaya-ku, and Ota-ku
◆Movements by Quarter: Average Gross Yield on Contract Price / Average Gross Yield on Initial Asking Price / Number of Transactions
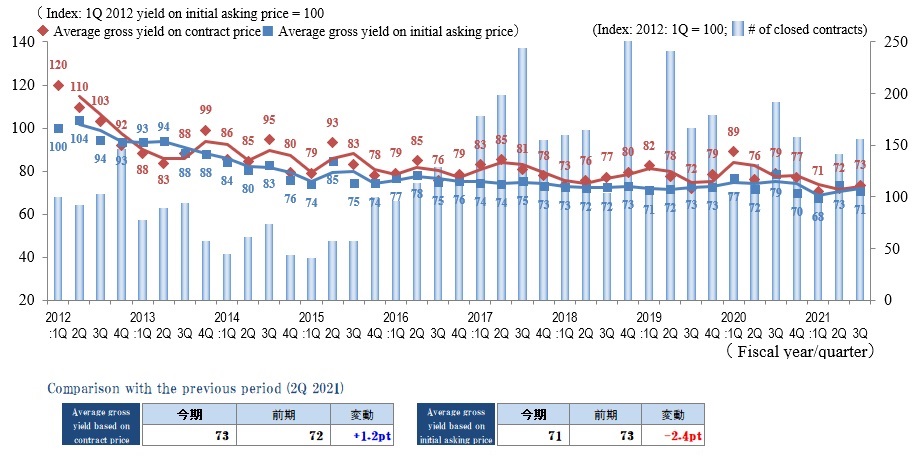
◆Brokered Transactions of Investment Real Estate in the Submarket
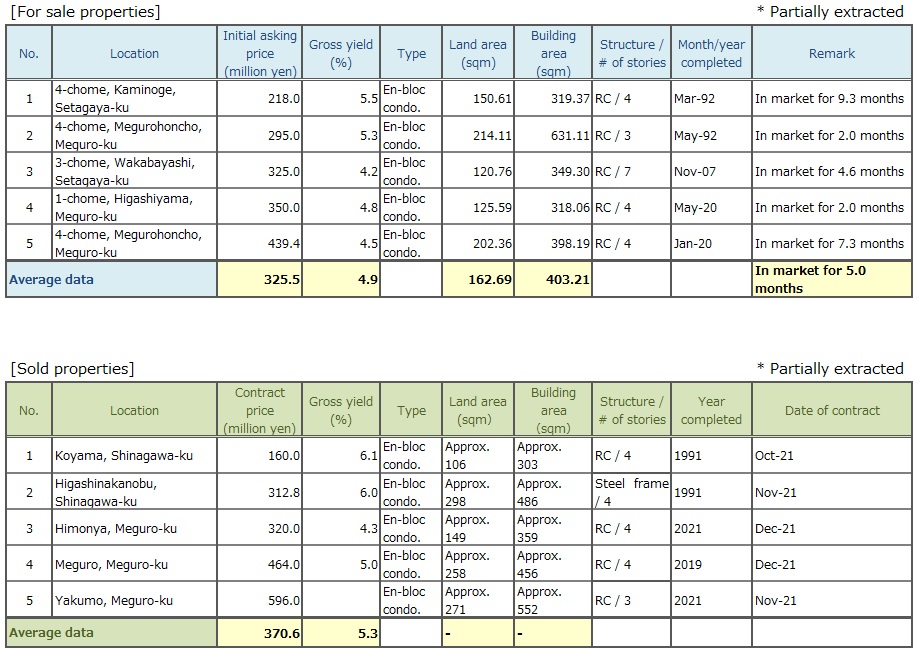
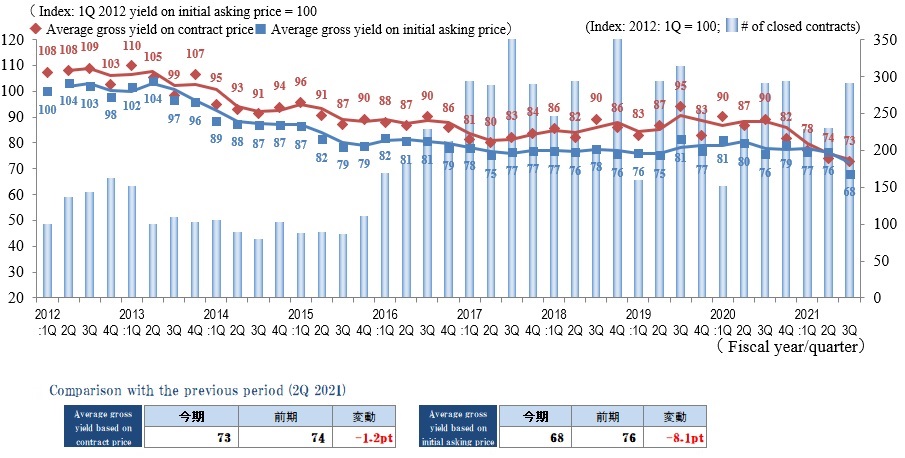
Index of Average Gross Yield on Contract Price in 3Q / FY 2021 here inched up by 1.2 pt. QoQ to 73. This is an increase (or decrease in price), though small, for two quarters in a row. Index of Average Gross Yield on Initial Asking Price, however, fell (or price went up) by 2.4 pt. QoQ to 71.Number of Transactions grew by approximately 10% QoQ. This is also an increase for two quarters in a row.
There may be a few reasons for the growth in the number of transactions. First of all, simply there was an increase in the supply of properties for sale. Secondly, a gap between an yield on asking price and expected rate of return by a prospective buyer has narrowed, hence disparity in levels of pricing by a seller and buyer has shrunk.
In this submarket, the index of Average Gross Yield on Initial Asking Price has been hovering around the 70's for the last 12 months.
And there won't be a big shift in a level of market yield, unless there are significant changes in rent levels or financial market in the future. It is necessary to pay close attention to the impact on the real estate market of the stagnation of socioeconomic activities and interest rate trends due to recent resurgence of the COVID-19 infection.
Pick Up Area -Tokyo North / West submarket-
(*) Tokyo North / West submarket: Suginami-ku, Nakano-ku, Nerima-ku, Toshima-ku, Itabashi-ku, Kita-ku, and Taito-ku
◆Movements by Quarter: Average Gross Yield on Contract Price / Average Gross Yield on Initial Asking Price / Number of Transactions
◆Brokered Transactions of Investment Real Estate in the Submarket
Number of Transactions in this submarket for 3Q / FY 2021 was significantly higher than the previous quarter. Index of Average Gross Yield on Contract Price was down 1.2 pt. (price increased) QoQ to 73, and index of Average Gross Yield on Initial Asking Price dropped (price increased) by 8.1 pt. QoQ to 68.
Both indices of Average Gross Yield on Contract Price and Average Gross Yield on Initial Asking Price were all-time low records since the beginning of the survey in 2012, and approaching levels of those in Tokyo South submarket. Market conditions for investment real estate in this submarket can be called extremely good still, since contract prices have been steadily rising since 3Q / FY 2020.One reason for the brisk market is that this submarket attracts investors' attention because of less expensive prices and more attractive yields than they can find in Tokyo Central and South submarkets.
However, the pace of a decline in yield (or gain in price) has been accelerating in FY2021, and it is necessary from now on to deliberate carefully about real estate investment in light of the impact of the rapidly spreading Omicron stock on socio-economic activities, while keeping a close eye on future movements in the investment real estate market.
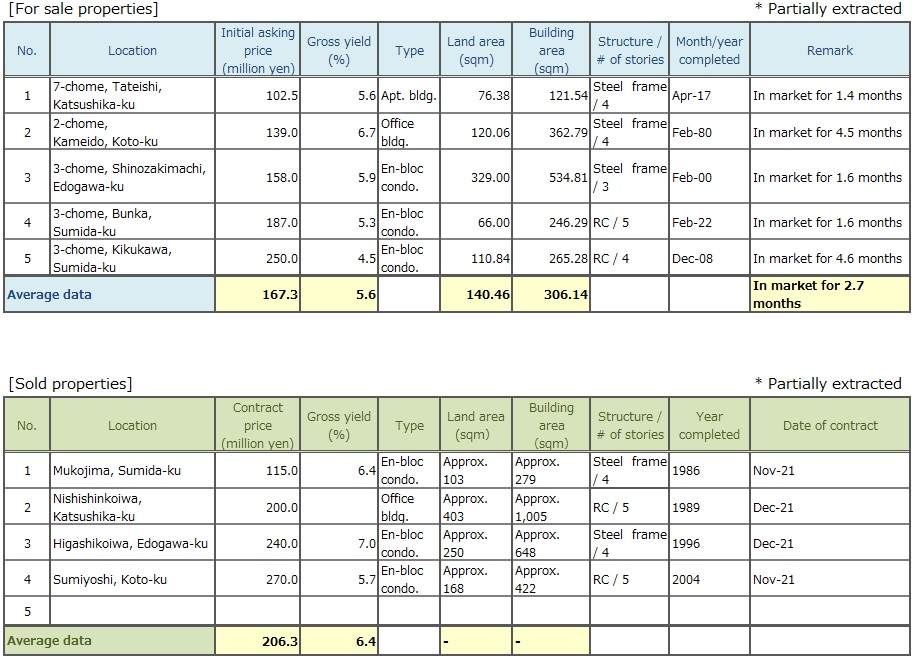
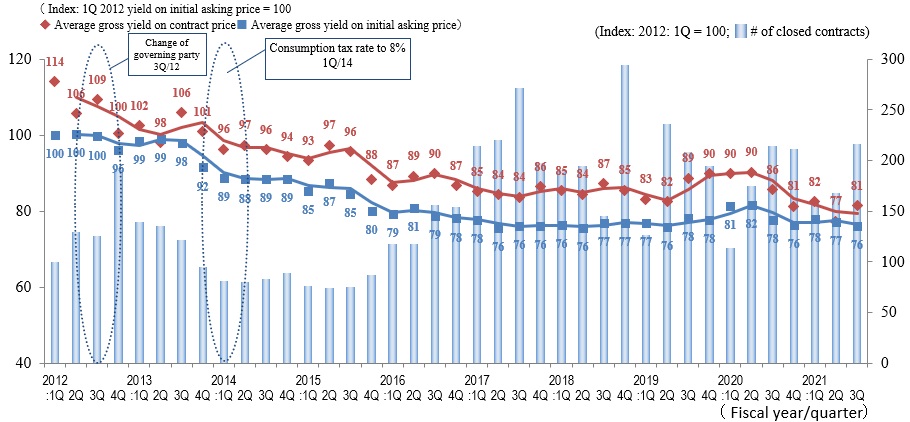
Pick Up Area -Tokyo East submarket-
(*) Tokyo East submarket: Koto-ku, Sumida-ku, Arakawa-ku, Edogawa-Ku, Katsushika-ku, and Adachi-ku
◆Movements by Quarter: Average Gross Yield on Contract Price / Average Gross Yield on Initial Asking Price / Number of Transactions
◆Brokered Transactions of Investment Real Estate in the Submarket
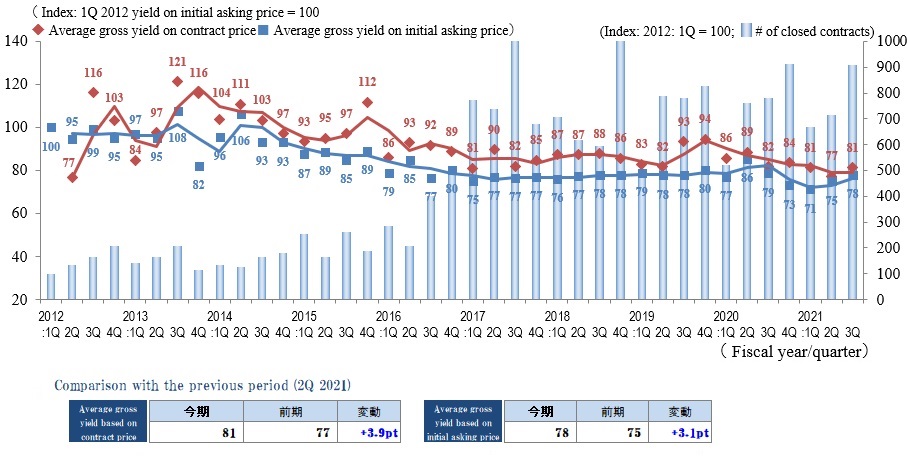
Number of Transactions in this submarket for 3Q / FY 2021 exceeded that of 3Q / FY 2020.Indices of Average Gross Yield on Contract Price and Average Gross Yield on Initial Asking Price were 81 (plus 3.9 pt. QoQ, or decrease in price) and 78 (plus 3.1 pt. QoQ, or decrease in price), respectively. It was the third consecutive quarterly increase in Average Gross Yield on Initial Asking Price (or decrease in price) since 1Q / FY 2021. However, real estate market conditions here have been solid and stable without turmoil (without significant widening of the spread between contract and initial asking prices).Though the number of people infected with COVID-19 has gone up day by day due to the spread of the Omicron variant toward the end of 3Q, the impact is limited in this submarket so far, and properties with such selling points as close proximity to stations, good size, and high visibility, move well still.
As for new supply, however, condo. developers are taking a wait-and-see attitude now because of oversupply in studio and 1 bedroom units for one-person households, lengthening of leasing periods, and need for downward revision of rents, as a result of aggressive developments and competition for available land among them pushing land prices in this submarket up for the last few years. It will be necessary to pay close attention to movements of markets, including rental market.
Pick Up Area -Yokohama / Kawasaki region-
(*) Yokohama and Kawasaki region: Yokohama city, Kawasaki city
◆Movements by Quarter: Average Gross Yield on Contract Price / Average Gross Yield on Initial Asking Price / Number of Transactions
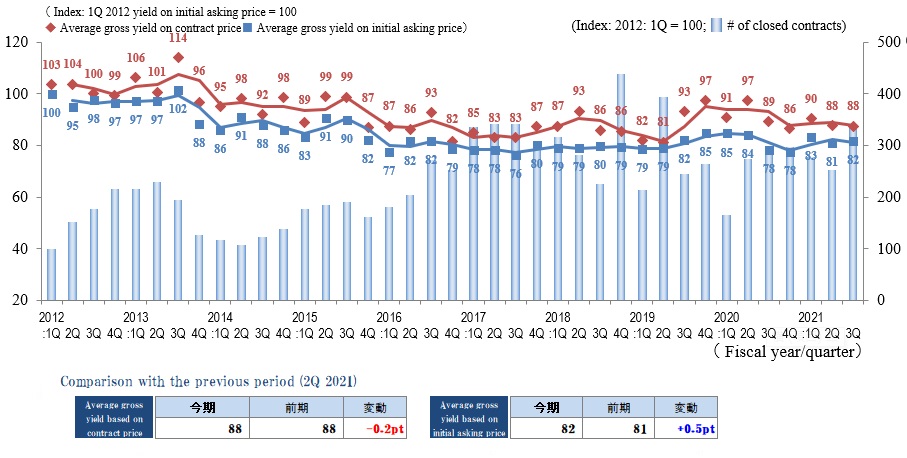
◆Brokered Transactions of Investment Real Estate in the Submarket
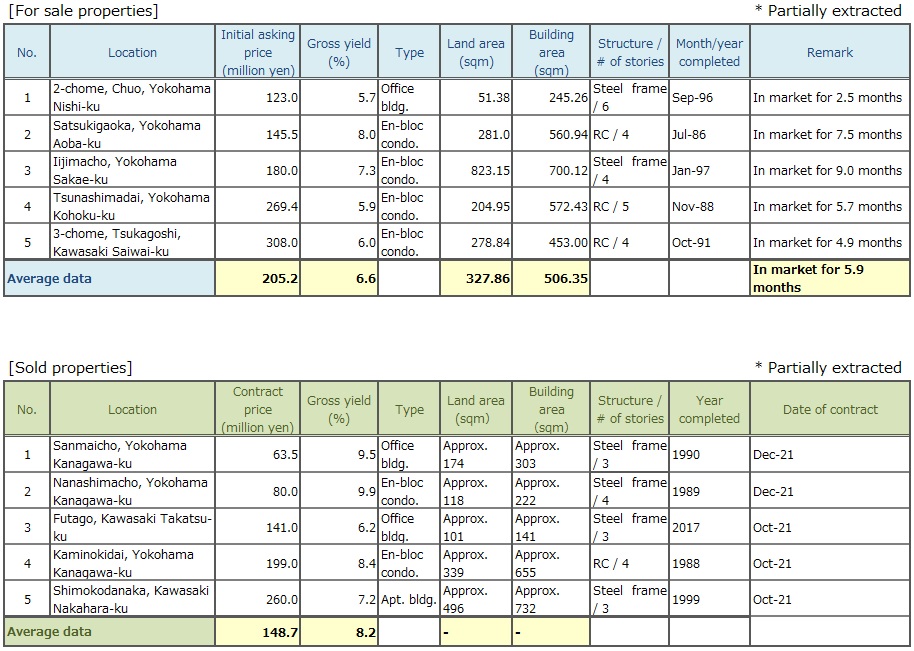
Number of Transactions for Yokohama / Kawasaki region in 3Q / FY2021 leaped on both QoQ and YoY bases. The market seemed to come to a standstill once in the last quarter, but it became brisk again.
Also in terms of pricing, investment real estate market here can be judged to be active, since indices of both Average Gross Yield on Contract Price and Average Gross Yield on Initial Asking Price remain low with little change from the previous quarter.
Though there were an increasing number of cases where properties of lesser physical quality changed hands at yields exceeding 10% since last year, such cases were not noticeable this quarter, either. The situation of market polarization, however, remain unchanged, as number of days on the market for a property to be sold is growing especially in suburban areas, and tendency for sellers to rush into a price-cutting free-for-all is evident.
There continues a brisk demand to buy due to strong inflow of investment money into real estate market. On the other hand, there is a limited supply of quality assets sought after by investors. Such mismatch between supply and demand must be a major cause for a market price stuck at the high level.
Needless to say, there is a danger of the sixth wave of COVID-19 infections toward the end of this fiscal year. Uncertainties abound in the real economy, such as the rising cost of living due to soaring prices of natural resources, interest rate trends in the US and Europe, and states of Sino-American and Russo-American affairs. It will be necessary to pay close attention to the development of these matters.
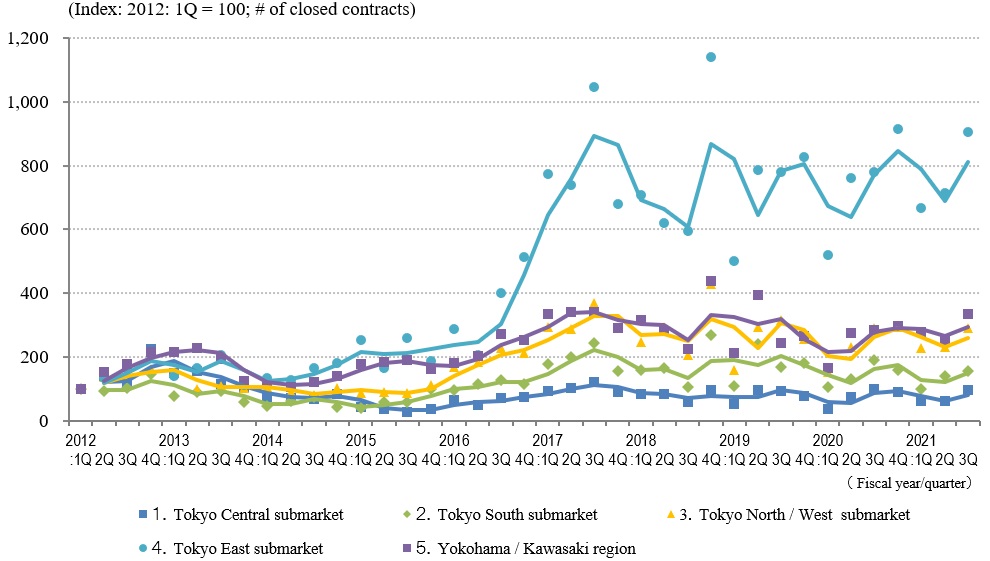
General overview
◆Movements by Quarter: Average Gross Yield on Contract Price / Average Gross Yield on Initial Asking Price / Number of Transactions for the 5 Areas
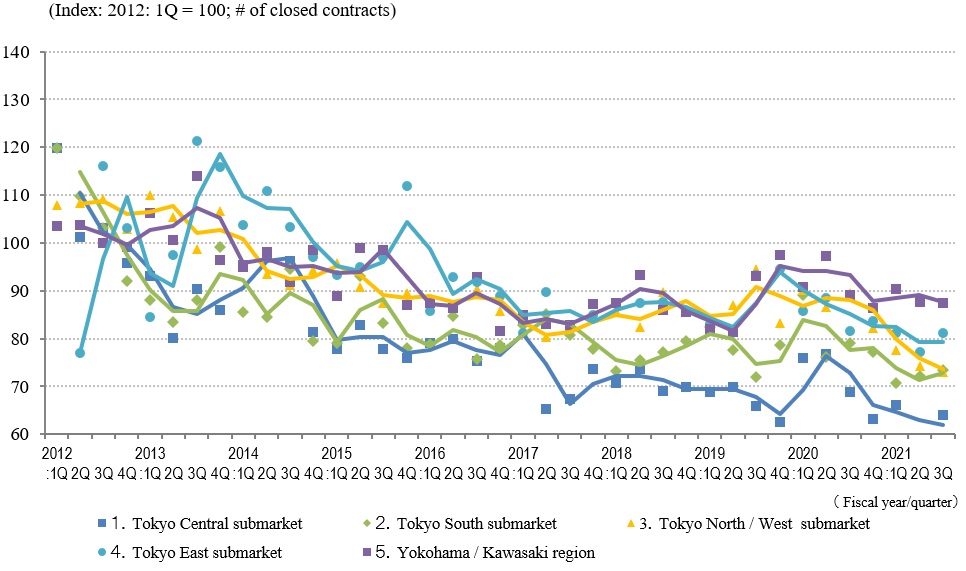
◆Movements in Number of Transactions by Area
◆Movements in Average Gross Yield on Contract Price by Area
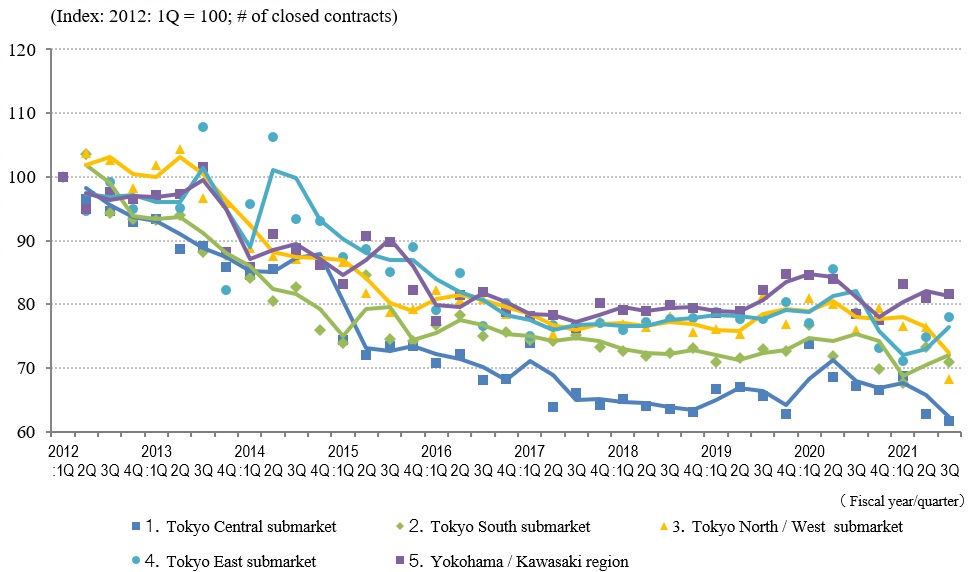
◆Movements in Average Gross Yield on Initial Asking Price by Area
Overall number of transactions for the quarter surged QoQ (to approximately 129% of the previous quarter). Actually, the number of transactions increased QoQ across all the submarkets and region for the first time since 3Q / FY2020, a year ago. Though it was by a small margin, the overall number of transactions this quarter outdid that of 3Q a year ago and two years ago.
As far as Average Gross Yield on Contract Price is concerned, it fell in Tokyo North / West submarket (prices rose) and levelled off in Yokohama / Kawasaki region while it went up in Tokyo Central, South, and East submarkets (prices fell).Index of Average Gross Yield on Contract Price fell below index of Average Gross Yield on Initial Asking Price in Tokyo Central and North / West submarkets earlier in FY 2021, but such reversal of yields was not observed anywhere this quarter.
It is still safe to say the real estate investment market remain buoyant as there is no meaningful change in a low level of yields.
In Tokyo North / West submarket, index of Average Gross Yield on Initial Asking Price plunged this quarter and fell below that of Tokyo South submarket for the first time ever. It seems that the bullish market sentiment in Tokyo Central and South submarkets is infiltrating into Tokyo North / West submarket.
Prospects for the future economic conditions are unclear, because of not only international situations such as tensions in Ukraine and CPI / interest rate hikes in the U.S. but also domestic issues such as the impact of Omicron strain on economy, rising gasoline prices due to devaluating Japanese yen and high crude oil prices, rising interest rates, and volatility in the stock market. It may be prudent to carefully examine real estate investment now.