Our Site uses cookies to improve your experience on our website. For more details, please read our Cookie Policy.
By closing this message or starting to navigate on this website, you agree to our use of cookies.
Our Site uses cookies to improve your experience on our website. For more details, please read our Cookie Policy.
By closing this message or starting to navigate on this website, you agree to our use of cookies.


Contact
Mitsui Fudosan Realty can provide a wide range of real estate services on both investment and residential properties.
Please feel free to give us a call or contact with mail inquiry.
Phone
- China400-120-1319
- HongKong800-93-3060
- Taiwan00801-81-2728
- Japan0120-923-431
- Other Regions+81-3-6758-4072

Quarterly Report for Premium Condominiums in Tokyo | 4Q FY 2021

Dear Valued Customers:
Thank you very much for your inquiry and business. We at International Dept. of Mitsui Fudosan Realty would like to share with you the trend in the high-end condominium market of central Tokyo here.
【Chart 1】
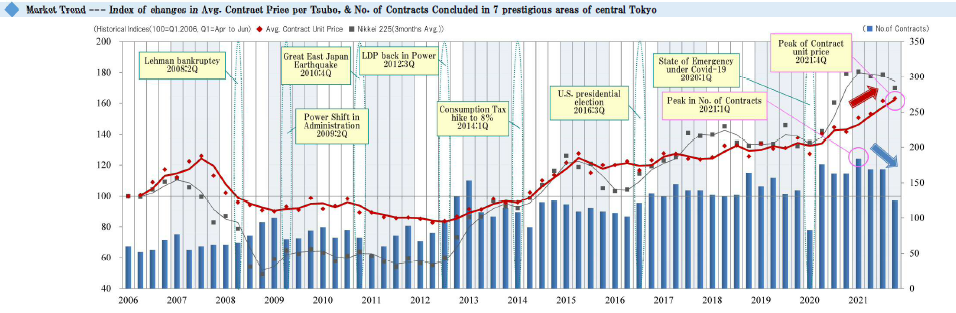
This graph shows an index of changes in average contract price per tsubo (*Notes: 1. Indexation using average contract price per tsubo in 1Q / FY 2006 as 100. 2. Tsubo is a Japanese traditional unit of area equal to approx. 3.31sqm.) and the number of contracts concluded every quarter for premium condo. units in 7 prestigious areas of central Tokyo.
Major economic events and Nikkei Stock Average are also shown for reference. The bar graph represents the number of contracts concluded each quarter. The red-line shows a movement in the index of average contract price per tsubo, while the gray-line shows one in the Nikkei stock average.
In the 4th quarter reviewed here (Jan. 1 thru March 31, 2022 based on Japanese fiscal year), the index of average contract price per tsubo went up by 1.6 point from the previous quarter to reach 163.2, hitting an all-time high since the beginning of data collection in 2006 for four quarters in a row. On the other hand, the number of contracts concluded in the same quarter dropped by 45 from the previous quarter to 124 contracts.
【Chart 2】
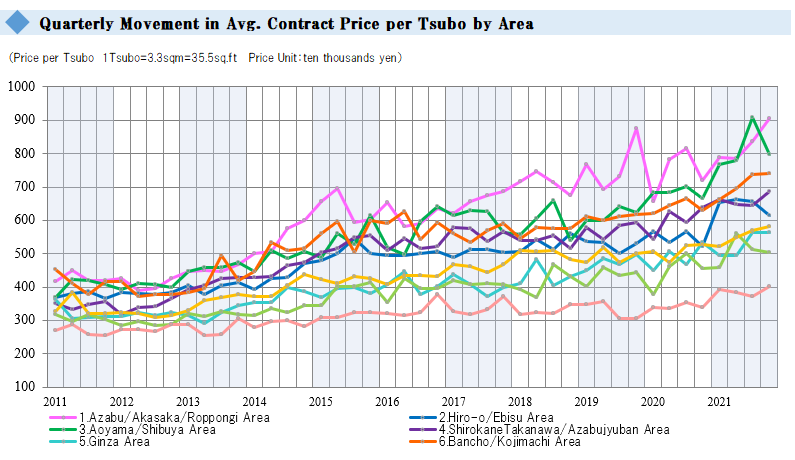
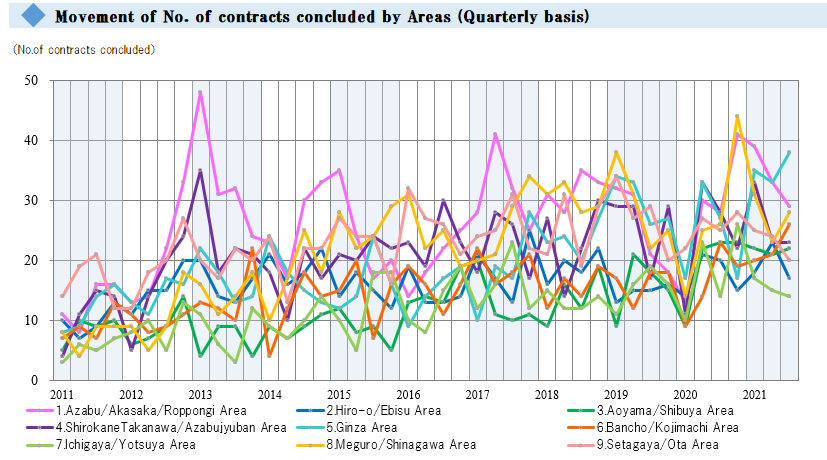
The line graphs 1 thru 9 in Chart 2 above indicate the average contract prices per tsubo for 9 different areas (1. “Azabu/ Akasaka / Roppongi Area,” 2. “Hiro-o / Ebisu Area,” 3. “Aoyama / Shibuya Area,” 4. “Shirokane Takanawa / Azabujuban Area,” 5. “Ginza Area,” 6. “Bancho / Kojimachi Area,” 7. “Ichigaya / Yotsuya Area,” 8. “Meguro / Shinagawa Area,” and 9. “Setagaya / Ota Area”), while the line graphs 1 thru 9 in Chart 3 below indicate the number of contracts concluded in those areas.
【Chart 3】
In five areas including “Azabu / Akasaka / Roppongi Area,” “Shirokane Takanawa / Azabujuban Area,” “Bancho / Kojimachi Area,” “Meguro / Shinagawa Area,” and “Setagaya / Ota Area,” the average contract price per tsubo rose from the previous quarter and recorded new historical highs since the beginning of data collection in 2006.
Especially in “Bancho / Kojimachi Area,” and “Meguro / Shinagawa Area,” it was for three consecutive quarters that the average contract price per tsubo reached new highs. In “Ginza Area,” the average contract price per tsubo remained unchanged, while it went down in “Hiro-o / Ebisu Area,” “Aoyama / Shibuya Area,” and “Ichigaya / Yotsuya Area.” As for the number of contracts concluded, it went down in all the areas (namely in “Azabu / Akasaka / Roppongi Area,” “Hiro-o / Ebisu Area,” “Aoyama / Shibuya Area,” “Shirokane Takanawa / Azabujuban Area,” “Ginza Area,” “Bancho / Kojimachi Area,” “Ichigaya / Yotsuya Area,” and “Meguro / Shinagawa Area”), except for “Setagaya / Ota Area” where the number went sideways. Especially in “Ginza Area,” “Bancho / Kojimachi Area,” and “Meguro / Shinagawa Area,” the drop in volume was as significant as 10 cases or more.
Overall, it is safe to say the average contract price per tsubo kept rising in most areas, while there was a sharp drop in the number of contracts concluded in this quarter. Despite a small improvement in the number of listings to 476 at the end of this quarter (March 31, 2022) compared to 457 listings at the end of 4Q / FY 2020 (March 31, 2021) or 432 listings at the end of the previous quarter (Dec 31, 2021), it will be prudent to closely watch not only a change in number of listings but also developments in economic and financial conditions in observing the future market trend.
We hope this is helpful and are looking forward to another opportunity to serve you. Thank you and best regards,
International Dept. Mitsui Fudosan Realty Co., Ltd.
E-mail : tokyoproperty@mf-realty.jp
Phone : +81-3-6758-4019
Toll free (from Japan): 0120-599-321
Office Hour: 10:00 am – 6:00pm (Japan Time)
Office Closed: Saturdays, Sundays and National holidays