Our Site uses cookies to improve your experience on our website. For more details, please read our Cookie Policy.
By closing this message or starting to navigate on this website, you agree to our use of cookies.
Our Site uses cookies to improve your experience on our website. For more details, please read our Cookie Policy.
By closing this message or starting to navigate on this website, you agree to our use of cookies.


Contact
Mitsui Fudosan Realty can provide a wide range of real estate services on both investment and residential properties.
Please feel free to give us a call or contact with mail inquiry.
Phone
- China400-120-1319
- HongKong800-93-3060
- Taiwan00801-81-2728
- Japan0120-923-431
- Other Regions+81-3-6758-4072

Quarterly Report for Premium Condominiums in Tokyo | 2Q FY 2022
Dear Valued Customers:
Thank you very much for your inquiry and business. We at International Dept. of Mitsui Fudosan Realty would like to share with you the trend in the high-end condominium market of central Tokyo here.
【Chart 1】

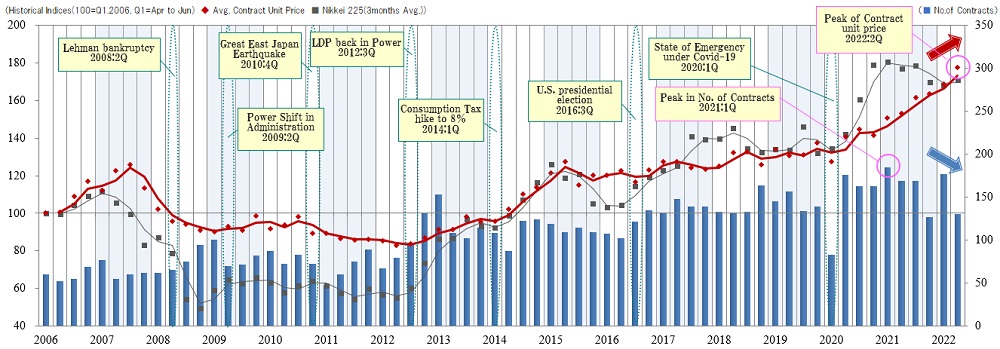
This graph shows an index of changes in average contract price per tsubo (*Notes: 1. Indexation using average contract price per tsubo in 1Q / FY 2006 as 100. 2. Tsubo is a Japanese traditional unit of area equal to approx. 3.31sqm.) and the number of contracts concluded every quarter for premium condo. units in 7 prestigious areas of central Tokyo.
Major economic events and Nikkei Stock Average are also shown for reference. The bar graph represents the number of contracts concluded each quarter. The red-line shows a movement in the index of average contract price per tsubo, while the gray-line shows one in the Nikkei stock average.
In the 2nd quarter reviewed here (July 1 thru Sept. 30, 2022 based on Japanese fiscal year), the index of average contract price per tsubo for premium condominium units sold went up by 8.5 point QoQ to reach 177.5, hitting an all-time high since the beginning of data collection for six quarters in a row. On the other hand, the number of contracts concluded in the same quarter dropped significantly to 130, down by 47 QoQ.
【Chart 2】

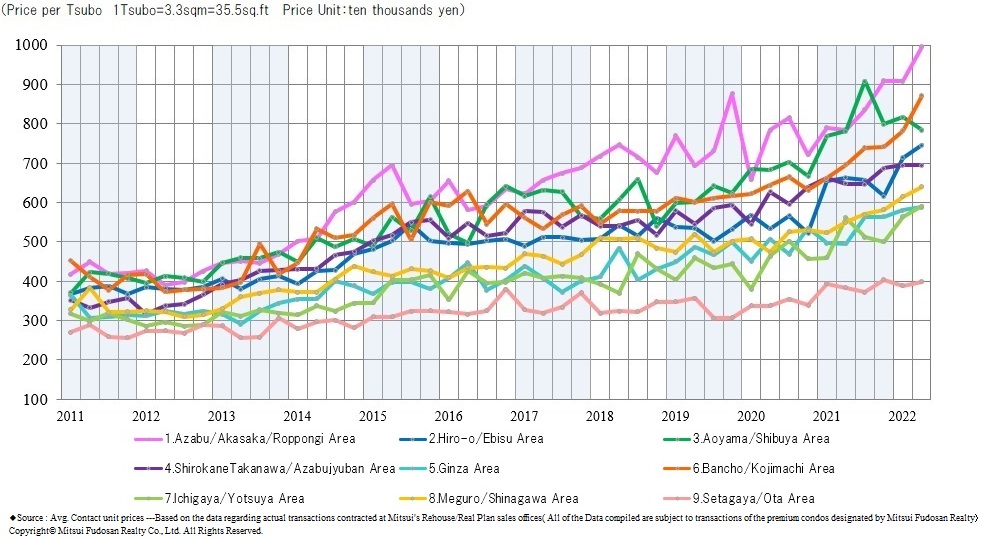
The chart above shows average contract price per tsubo. In this quarter, average contract price per tsubo went up in all the areas except for "Aoyama / Shibuya Area" and "Shirokane Takanawa / Azabujuban Area." Six out of those seven areas excluding "Setagaya / Ota Area" recorded historical highs since the beginning of data collection. In case of "Hiro-o / Ebisu Area," "Ginza Area," and "Ichigaya / Yotsuya Area," this is the second consecutive time to hit the record high. And in case of "Bancho / Kojimachi Area," and "Meguro / Shinagawa Area," this the fifth consecutive time to do so.
【Chart 3】

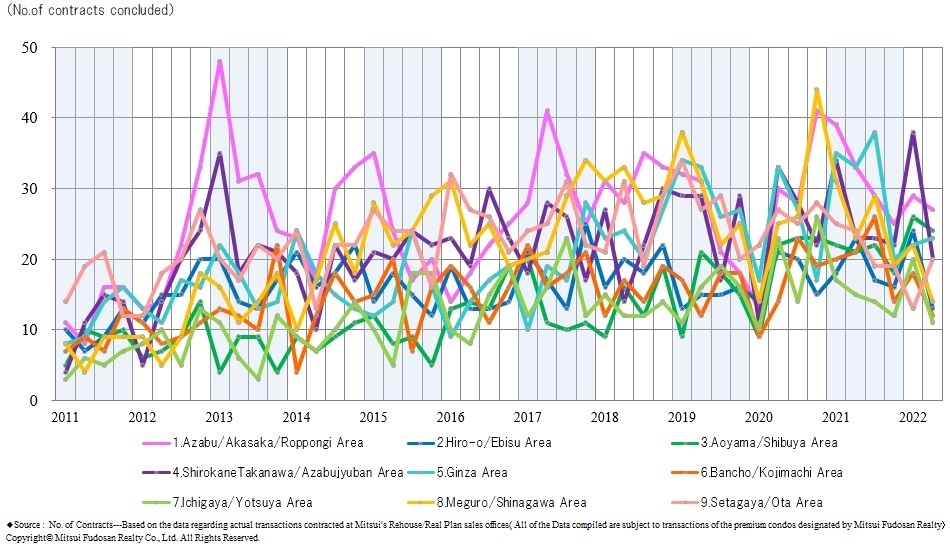
Now let's look at the chart above for number of contracts concluded. While the number increased in two areas, i.e. "Ginza Area," and "Setagaya / Ota Area," it declined in seven other areas. Especially in such two areas as "Hiro-o / Ebisu Area," and "Shirokane Takanawa / Azabujuban Area," there were steep drops by more than 10 cases QoQ.
In summary, there were many areas which set new records in average contract price per tsubo, but the number of contracts concluded declined significantly. As far as buyer's intentions are concerned, the number of properties bought for use as buyer's own residence is on a downward trend, while the number of properties bought as second-homes and investment is rising. Also inbound demand is coming back triggered by a sharp devaluation of the Japanese Yen. From now on, it will be prudent to keep closely watching impact from large-scale developments and fluctuations in number of contracts concluded in each area, especially the volume of transactions at large and recently built properties, on top of the world, economic and financial situations.
We hope this is helpful and are looking forward to another opportunity to serve you. Thank you and best regards,
International Dept. Mitsui Fudosan Realty Co., Ltd.
E-mail : tokyoproperty@mf-realty.jp
Phone : +81-3-6758-4019
Toll free (from Japan): 0120-599-321
Office Hour: 10:00 am – 6:00pm (Japan Time)
Office Closed: Saturdays, Sundays and National holidays