Our Site uses cookies to improve your experience on our website. For more details, please read our Cookie Policy.
By closing this message or starting to navigate on this website, you agree to our use of cookies.
Our Site uses cookies to improve your experience on our website. For more details, please read our Cookie Policy.
By closing this message or starting to navigate on this website, you agree to our use of cookies.


Contact
Mitsui Fudosan Realty can provide a wide range of real estate services on both investment and residential properties.
Please feel free to give us a call or contact with mail inquiry.
Phone
- China400-120-1319
- HongKong800-93-3060
- Taiwan00801-81-2728
- Japan0120-923-431
- Other Regions+81-3-6758-4072

Investment Real Estate Market Report | 2Q FY2022
Foreword
Thank you very much for your continued support and business.
We, at Mitsui Fudosan Realty, have been providing a broad range of services in order for our valued clients to make the "Best Use" of precious assets, and attentive consultation about concerns and worries clients have with respect to assets in various conditions, not only through brokerage of business and investment properties but also by helping clients to utilize assets effectively for such purposes as estate and tax planning.
As part of these efforts, we prepare an "Investment Real Estate Market Report" for reference to help clients grasp the situation affecting real estate holdings. Since the investment real estate market is susceptible to external factors such as economic trends, an objective point of view is essential to understand the current market conditions. It is our great pleasure if this report is instrumental for readers to develop asset building strategies.
We will continue striving to deliver long-term support through development, implementation, and follow-up of plans that will satisfy clients, meet demands of each client on a "one to one" basis by making the most of professional expertise and experience gained over the years, and prove worthy of clients' trust.
Please feel free to contact us at the office below with any comments or requests concerning this report, or any matters related to real estate assets.
We look forward to opportunities to serve you soon.
Mitsui Fudosan Realty Co., Ltd.
Solution Business Division
■Toll-free Number: 0120-321-376
■Hours: 9:30 am - 6:00 pm Closed Saturdays, Sundays, and holidays
■3-2-5, Kasumigaseki, Chiyoda-ku, Tokyo 100-6019, Japan
We, at Solution Business Division of Mitsui Fudosan Realty Co., Ltd., have been producing a "Investment Real Estate Market Report" to serve as an aid to hopefully assisting our valued clients formulate a medium-to long term asset building plan.
Please also take a look at our website, which is full of useful information such as properties for sale, various consultation services, and articles by real estate experts.
Areas subject to collection of data
Tokyo Central submarket: Minato-ku, Chiyoda-ku, Chuo-ku, Shibuya-ku, Shinjuku-ku, and Bunkyo-ku
Tokyo South submarket: Shinagawa-ku, Meguro-ku, Setagaya-ku, and Ota-ku
Tokyo North / West submarket: Suginami-ku, Nakano-ku, Nerima-ku, Toshima-ku, Itabashi-ku, Kita-ku, and Taito-ku
Tokyo East submarket: Koto-ku, Sumida-ku, Arakawa-ku, Edogawa-ku, Katsushika-ku, and Adachi-ku
Yokohama / Kawasaki region: Yokohama city and Kawasaki city
Detailed descriptions
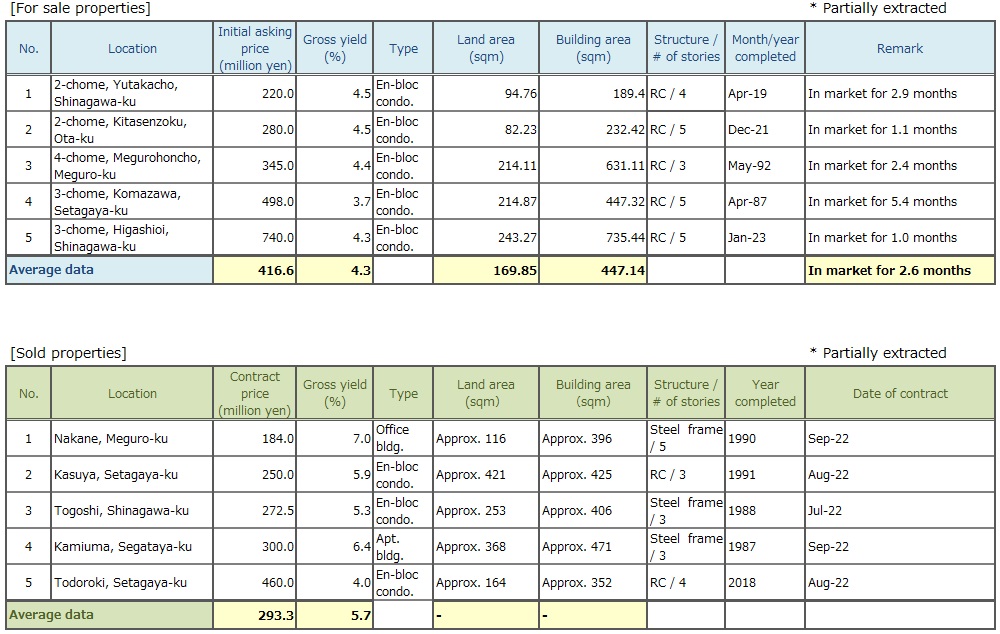
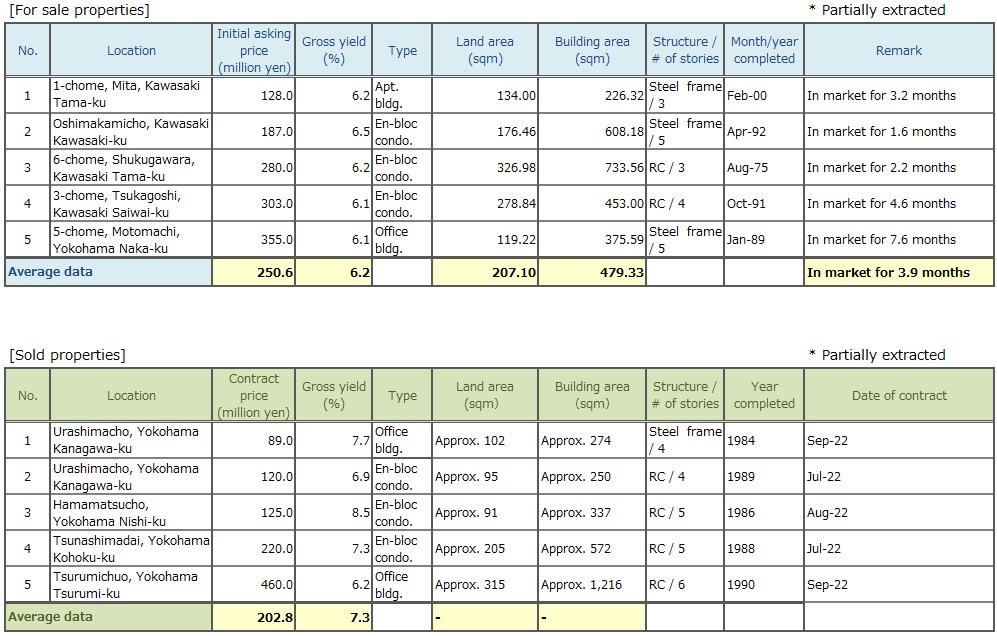
Pick Up Area: For investment real estate, trends in the average gross yields on contract price and initial asking price, together with the number of closed contracts by submarkets are represented in the graph. The details of the transition of actual market value and properties both for sale and sold in certain neighborhoods are also shown.
Market Overview: As an overview of all the submarkets, the trend from the past to this quarter is available. Trends in the average gross yields based on contract price and initial asking price together with the number of closed contracts by area are shown for comparison.
Data Source: Information is extracted from the database containing properties offered for sale and contracts concluded through Mitsui Fudosan Realty Network (En-bloc condominiums / office buildings / apartment buildings).
- Number of Transactions & Average Gross Yield on Contract Price: Number of contracts closed in a quarter (three months) and average gross yield of them (including estimated values)
- Average Gross Yield on Initial Asking Price: Quarterly average gross yield of closed contracts based on their asking price initially quoted
*Figures in each chart represent indices based on values for 1Q / FY2017 set at 100.
(Average Gross Yield on Contract Price is shown as an index to Average Gross Yield on Initial Asking Price for 1Q / FY 2017 set at 100.)
[Note] The historical data may be revised subsequently due to maintenance carried out from time to time, such as adding newly acquired data.
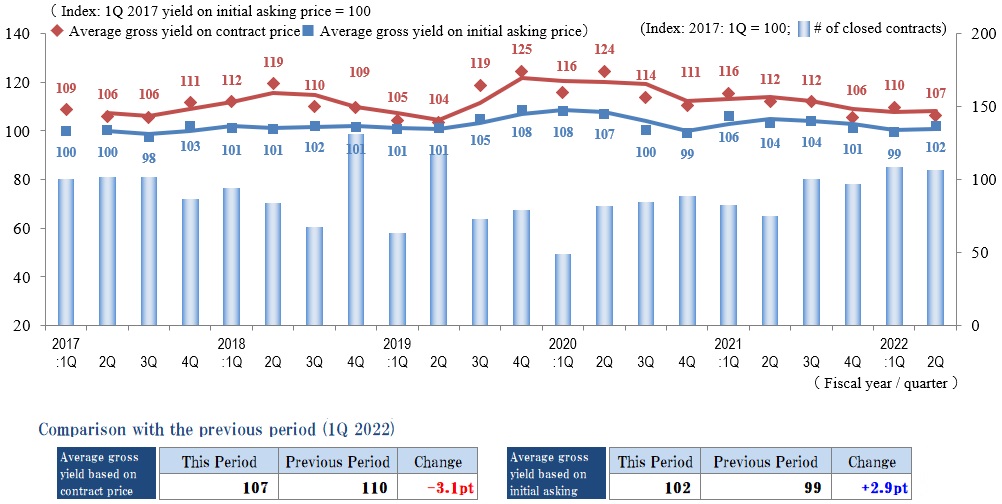
Pick Up Area -Tokyo Central submarket-
(*)Tokyo Central submarket: Minato-ku, Chiyoda-ku, Chuo-ku, Shibuya-ku, Shinjuku-ku, and Bunkyo-ku
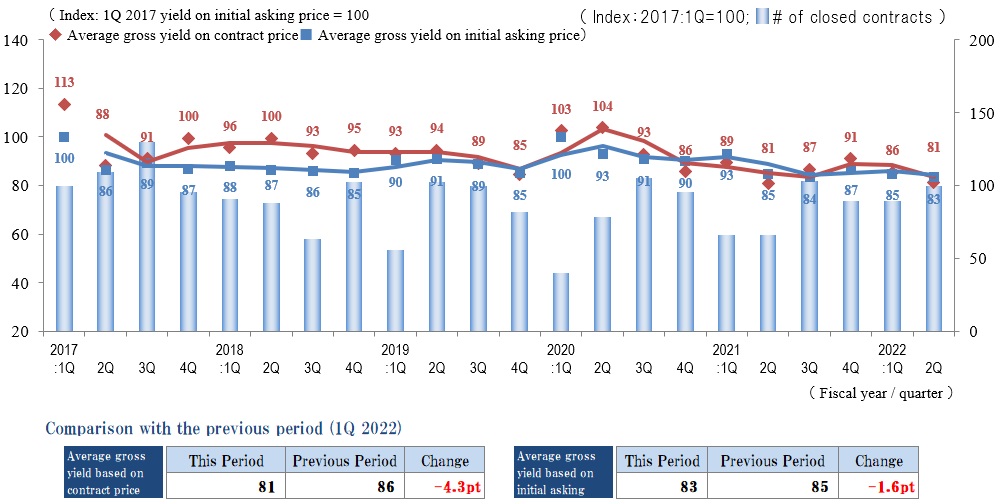
◆Movements by Quarter: Average Gross Yield on Contract Price / Average Gross Yield on Initial Asking Price / Number of Transactions
◆Brokered Transactions of Investment Real Estate in the Submarket

Number of transactions 2Q / FY 2022 in Tokyo Central submarket exceeded that of the year-earlier period significantly. Both initial asking and contract prices on average increased, pushing down Indices of Average Gross Yield on Initial Asking Price and Average Gross Yield on Contract Price to 81 (by 4.3 pt. QoQ) and 83 (by 1.6 pt. QoQ) respectively. In general, this submarket has continued strong for several years since 1Q / FY 2017, with both yields on initial asking price and contract price kept at a low level (or prices at a high level) and together with growing number of transactions.
Despite concerns about economic conditions such as tapering in the United States, price hikes and inflation fear at home associated with devaluation of the Japanese yen, Tokyo Central submarket for investment properties has been fairly stable without major fluctuations in yields for the last 12 months or so, which must have led to a growing number of transactions at a low level of yields.
Furthermore, inbound demand which has been revived by cheaper yen, is driving deals at low yields (or high prices), and an element to keep current yields at a low level in this market.
It will be prudent, however, to closely watch movements in supply of for-sale properties as well as changes in a foreign exchange market and economic climate, when the outlook for the global economy becomes uncertain as GDP for both US and China in 2Q (April-June) has shrunk QoQ and sharp rises in interest rate continue in the US.
Pick Up Area -Tokyo South submarket-
(*) Tokyo South submarket: Shinagawa-ku, Meguro-ku, Setagaya-ku, and Ota-ku
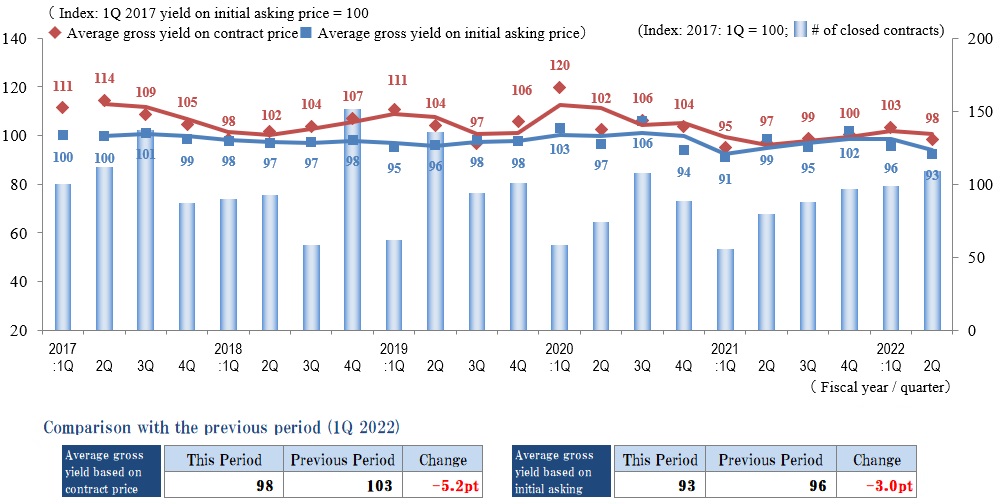
◆Movements by Quarter: Average Gross Yield on Contract Price / Average Gross Yield on Initial Asking Price / Number of Transactions
◆Brokered Transactions of Investment Real Estate in the Submarket
Index of Average Gross Yield on Contract Price 2Q / FY 2022 in this submarket fell for the first time after 5 quarters to 98 (down by 5.2 pt. QoQ) as the price level rose. Index of Average Gross Yield on Initial Asking Price also fell (or price rose) to 93, recording a drop by 3.0 pt. QoQ. By the way, this is the second lowest figure in Index of Average Gross Yield on Initial Asking Price since 1Q / FY 2017. As for Number of Transactions, it grew for five quarters in a row to reach the level about 110% of the previous quarter.
Both Indices of Average Gross Yield on Initial Asking Price and Contract Price declined, or price levels went up this quarter after they kept rising, or price levels kept declining, for about a year. Number of Transactions has increased despite lower yields, indicating an active condition of this submarket supported by vigorous demand. In positive response to such a favorable market condition, a growing number of assets are coming on the market to help bringing supply and demand into better balance.
Nonetheless, it will be necessary to carefully observe the consequences of changes in interest rates and investor sentiment for the real estate market amid mounting concerns for global recession.
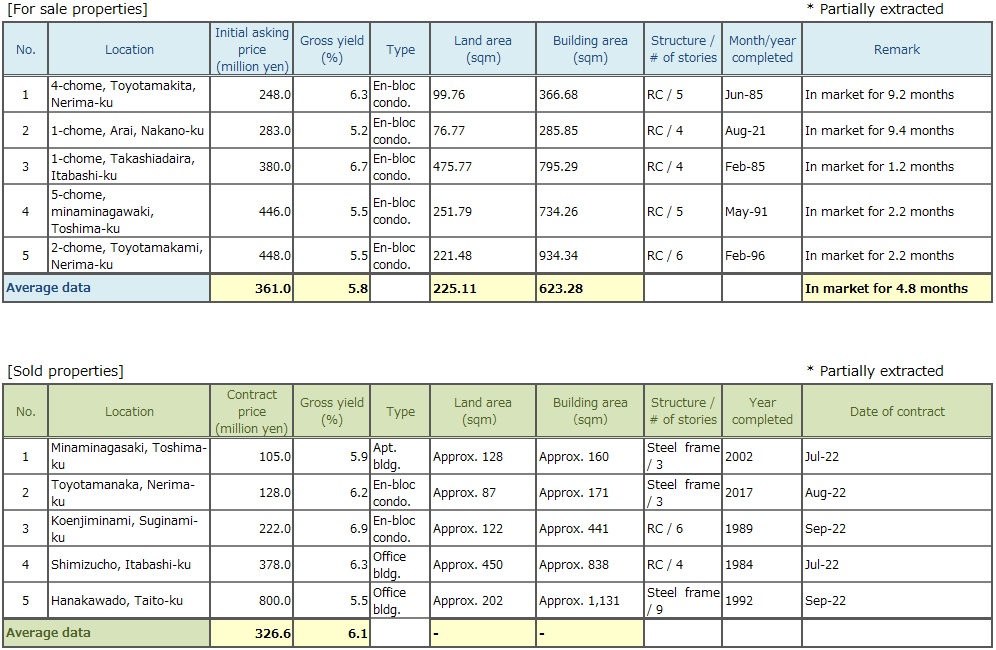
Pick Up Area -Tokyo North / West submarket-
(*) Tokyo North / West submarket: Suginami-ku, Nakano-ku, Nerima-ku, Toshima-ku, Itabashi-ku, Kita-ku, and Taito-ku
◆Movements by Quarter: Average Gross Yield on Contract Price / Average Gross Yield on Initial Asking Price / Number of Transactions
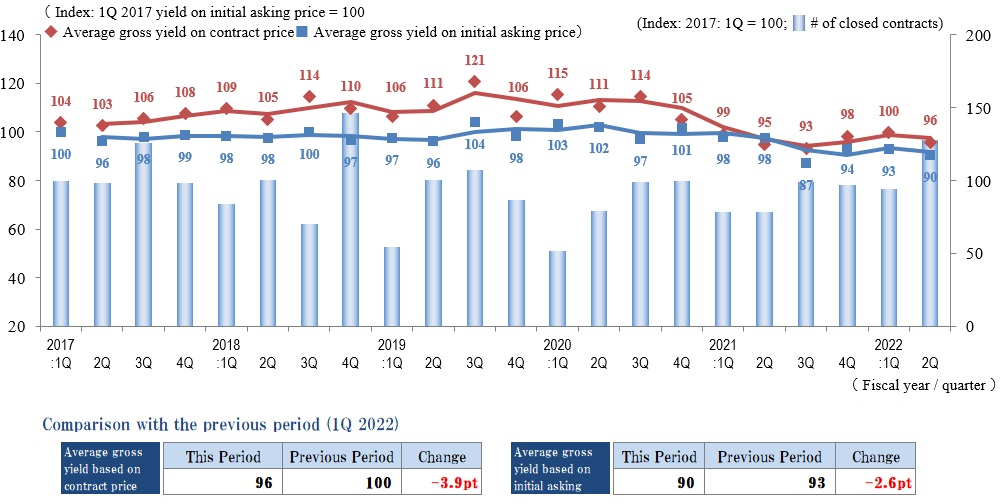
◆Brokered Transactions of Investment Real Estate in the Submarket
Number of Transactions in Tokyo North / West submarket 2Q / FY 2022 grew significantly QoQ. At the same time, Indices of Average Gross Yield on Contract Price and Average Gross Yield on Initial Asking Price came down by 3.9 pt. and 2.6 pt. respectively (price increased) QoQ. Contract price turned upward at the same time as transaction volume grew in this quarter, after Index of Average Gross Yield on Contract Price had been rising for two consecutive quarters (price decreased).
This submarket seemed to have recovered somewhat this quarter from a slight slowdown before. One reason for such recovery is that sellers revisit yields on asking prices for properties unsold for a long time while buyers who used to be cautious become more positive regaining interest to buy.
However, the market is still bipolarized as properties offered at attractive yields sell quickly while properties with aggressive yields remain in the market unsold for a prolonged period.
Future outlook for the real economy of Japan is unclear because commodity prices keep rising due to soaring energy prices as a result of the prolonged conflict in Ukraine and the inflation may be accelerated by devaluation of Japanese yen due to an interest rate gap between Japan and the United States. Going forward, it is necessary to keep a close eye on how such situation will affect the investment real estate market in Japan.
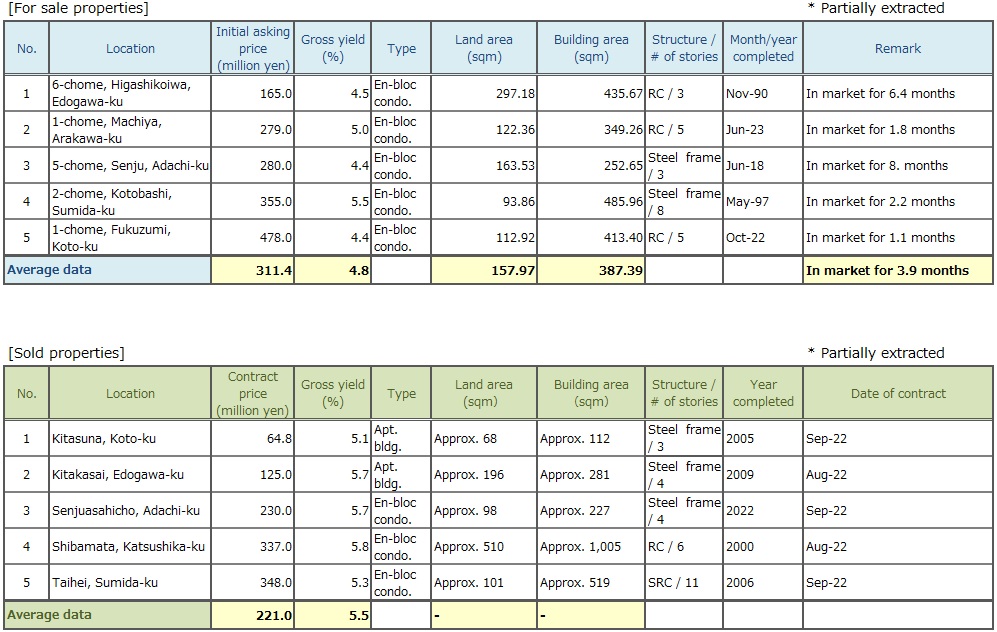
Pick Up Area -Tokyo East submarket-
(*) Tokyo East submarket: Koto-ku, Sumida-ku, Arakawa-ku, Edogawa-Ku, Katsushika-ku, and Adachi-ku
◆Movements by Quarter: Average Gross Yield on Contract Price / Average Gross Yield on Initial Asking Price / Number of Transactions
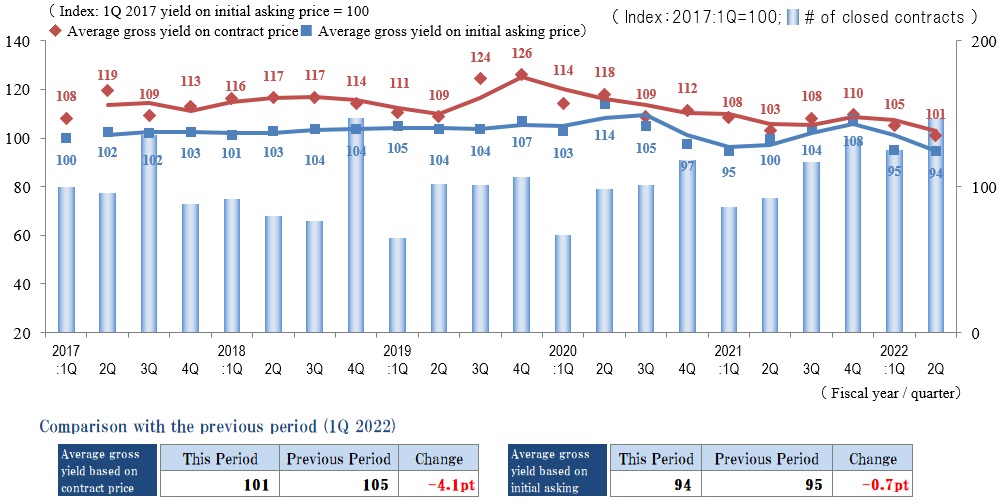
◆Brokered Transactions of Investment Real Estate in the Submarket
Number of Transactions 2Q / FY 2022 in Tokyo East submarket exceeded that of the year-earlier period significantly. Average Gross Yield on Contract Price was 101 (down by 4.1 pt. QoQ, as price increased), and Average Gross Yield on Initial Asking Price was 94 (down by 0.7 pt. QoQ, as price increased). Both Average Gross Yield on Contract Price and Average Gross Yield on Initial Asking Price reached record lows since 1Q / 2017, evidencing a brisk market here.
It remains to be seen how unsettling factors such as the conflict in Ukraine, interest rate hikes in the United States, and inflation associated with the rise in domestic energy prices will affect the real estate market. However, in this submarket, there seems to be an increase in the number of cases to deal with various real estate problems (elimination of co-ownership issues and countermeasures against obsolescence) under favorable market conditions now, which have been causes for concern for a long time.
It is also expected that inbound demand from overseas investors get stimulated by the devaluation of the Japanese yen. High-rise condo. units in central Tokyo will probably be shopped first like the time when inbound demand was heightened before COVID-19. But such wave of inbound demand is expected to reach Tokyo East submarket sooner or later, which boasts tourist destinations such as Asakusa, Ueno and Skytree. It seems necessary to keep a close eye on movement in this market.
Pick Up Area -Yokohama / Kawasaki region-
(*) Yokohama and Kawasaki region: Yokohama city, Kawasaki city
◆Movements by Quarter: Average Gross Yield on Contract Price / Average Gross Yield on Initial Asking Price / Number of Transactions
◆Brokered Transactions of Investment Real Estate in the Submarket
Number of Transactions 2Q / FY2022 in Yokohama / Kawasaki region was significantly higher than that of the same period a year earlier, though decreased QoQ. Thus this market is expected to be active still. There are a number of cases where properties have changed hands at lower gross yields than the average of the previous quarter (price increase). So aggressive pricing is still prevalent in this market.
On the other hand, there are also cases where asking prices are revised downward (or gross yields on asking prices increase) in order to sell quickly such properties as located in the suburban areas, far from the closest stations, or simply too old. This may explain why Average Gross Yield on Initial Asking Price has gone up QoQ overall.
The number of properties both coming on market and changing hands increased throughout 1Q and 2Q, and yields were on a downward trend, indicating that money continued to flow into the real estate market despite the unstable economic situation.
Although it is estimated that there will be no significant change in the market for the time being in the second half of FY 2022, it is prudent to closely watch uncertain factors in the real economy such as threat of COVID-19, higher commodity costs due to an increase in prices of natural resources, interest rate trends in the United States and Europe, and the devaluation of the Japanese yen.
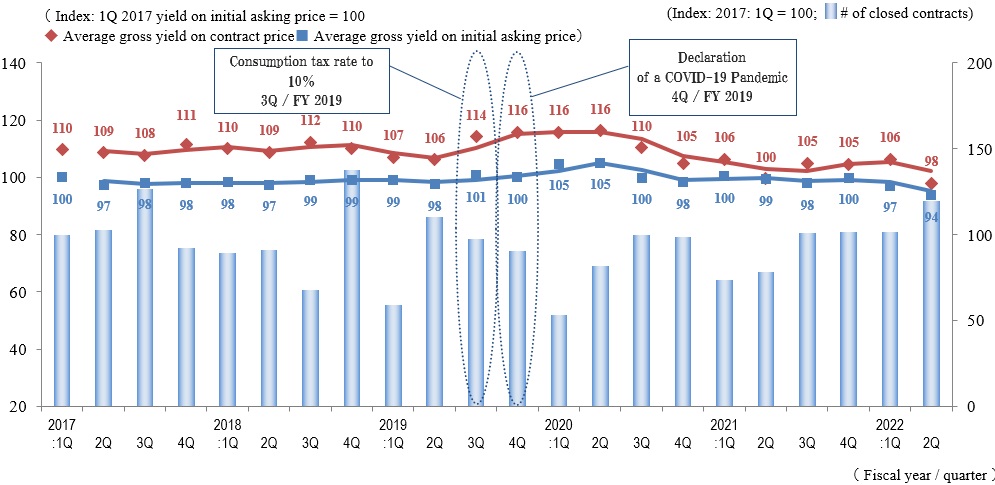
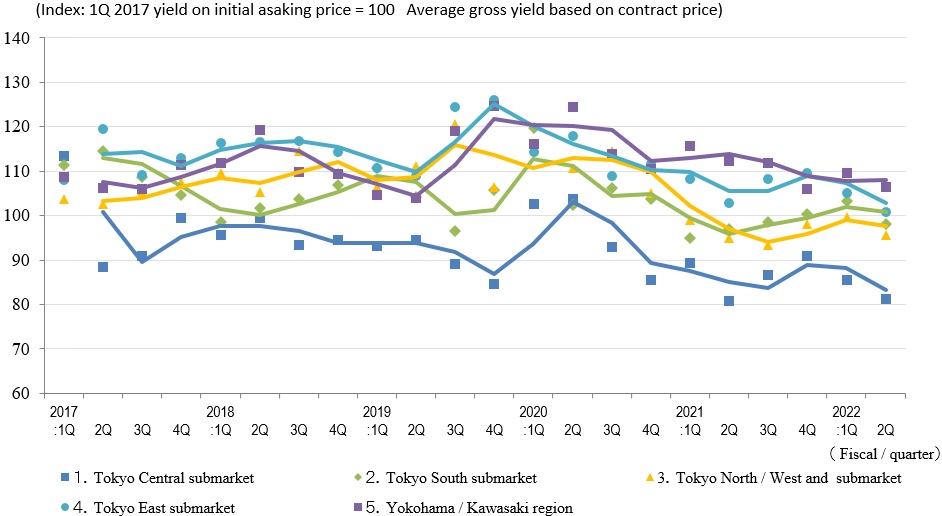
General overview
◆Movements by Quarter: Average Gross Yield on Contract Price / Average Gross Yield on Initial Asking Price / Number of Transactions for the 5 Areas
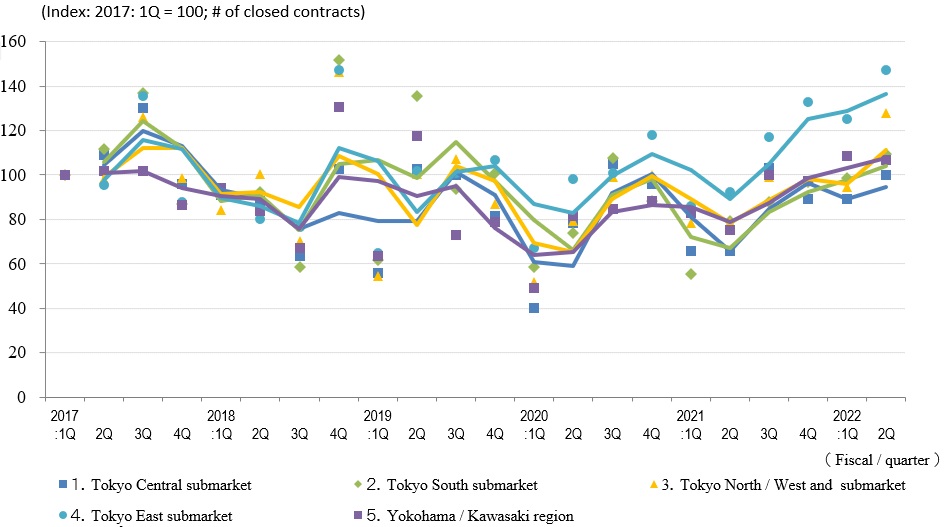
◆Movements in Number of Transactions by Area
◆Movements in Average Gross Yield on Contract Price by Area
◆Movements in Average Gross Yield on Initial Asking Price by Area
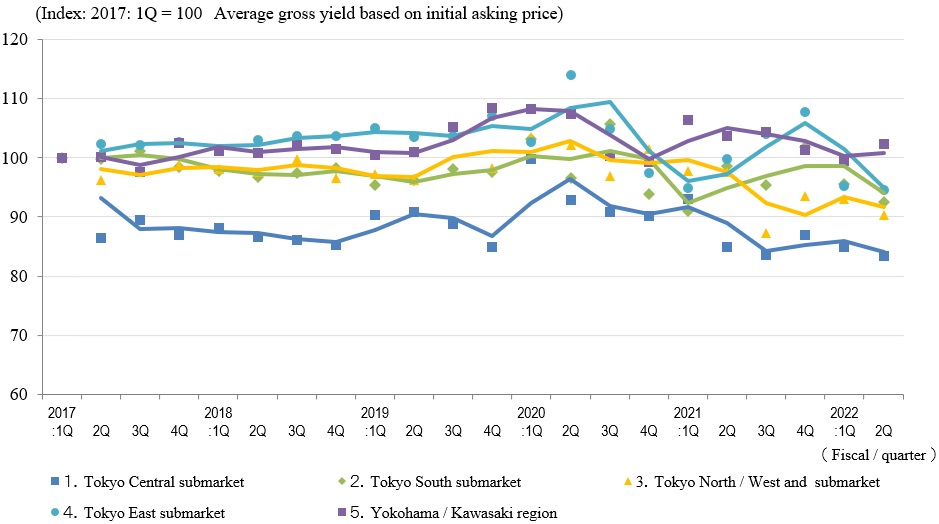
Number of Transactions 2Q / FY 2022 reached a record high since 4Q / FY 2019, when the COVID-19 pandemic was declared. The number grew QoQ in all submarkets of Tokyo, while only Yokohama / Kawasaki region showed a decline. On a YoY basis, however, the number showed an increase across all the submarkets and region, clearly evidencing a market recovery from the COVID-19 disaster.
As for yields, Tokyo Central submarket registered a decline (increase in prices) in Average Gross Yield on both Initial Asking Price and Contract Price. Actually, demand was so strong in the submarket that Average Gross Yield on Contract Price fell below Average Gross Yield on Initial Asking Price. On the other hand, Average Gross Yield on Contract Price went up (prices fell) in all the other submarkets and region except for Tokyo North / West where Average Gross Yield on Contract Price fell (price rose). Average Gross Yield on both Initial Asking Price and Contract Price came down to the lowest level this quarter since 1Q / FY 2017. Taking this into account as well as the expansion in the Number of Transactions at the same time, it can be said the real estate investment market in Tokyo is booming still.
While other developed countries are moving toward the control of inflation and monetary tightening, monetary relaxation and low interest rate policies are being maintained here, and there are concerns about their effect on devaluation of the Japanese yen and a rise in prices. Residential mortgage interest rates were revised upward last Fall. Impact of such changes in interest rates on the real estate market must be significant and closely monitored from now on.