Our Site uses cookies to improve your experience on our website. For more details, please read our Cookie Policy.
By closing this message or starting to navigate on this website, you agree to our use of cookies.
Our Site uses cookies to improve your experience on our website. For more details, please read our Cookie Policy.
By closing this message or starting to navigate on this website, you agree to our use of cookies.


Contact
Mitsui Fudosan Realty can provide a wide range of real estate services on both investment and residential properties.
Please feel free to give us a call or contact with mail inquiry.
Phone
- China400-120-1319
- HongKong800-93-3060
- Taiwan00801-81-2728
- Japan0120-923-431
- Other Regions+81-3-6758-4072

Investment Real Estate Market Report | 4Q FY 2020

Foreword
Thank you very much for your continued support and business. At Mitsui Fudosan Realty, we have been providing a broad range of services in order for clients to make the “Best Use” of precious assets, and attentive consultation services about concerns and worries clients have with respect to assets in various conditions, not only through brokerage of business and investment properties but also by helping clients to utilize assets effectively for such purposes as estate and tax planning.
As part of these efforts, we prepare ‘Investment Real Estate Market Report’ for reference to help clients grasp the situation affecting real estate holdings. Since the investment real estate market is susceptible to external factors such as an economic trend, an objective point of view is essential to understand the current market conditions. It is our great pleasure if this report is instrumental for readers to develop asset-building strategies.
We will continue striving to deliver long-term support through development, implementation, and follow-up of plans that will satisfy clients, meet demands of each client on one-on-one basis by making the most of professional expertise and experience gained over the years, and prove worthy of clients’ trust. Please feel free to contact us at the office below with any comments or requests concerning this report or any real-estate related matters. We look forward to the pleasure of serving you again.
Mitsui Fudosan Realty Co., Ltd.
Solution Business Division
■Toll-free Number: 0120-321-376
■Hours: 9:30 am - 6:00 pm Closed Saturdays, Sundays, and holidays
■3-2-5, Kasumigaseki, Chiyoda-ku, Tokyo 100-6019, Japan
We at Solution Business Division of Mitsui Fudosan Realty Co., Ltd. prepare ‘Investment Real Estate Market Report’ to help clients develop a medium-to-long term plan for asset building. Please also take a look at our website, which is full of useful information such as properties for sale, various consultation services, and articles by real estate experts.
Areas subject to collection of data
- Tokyo Central submarket:Minato-ku | Chiyoda-ku | Chuo-ku | Shibuya-ku | Shinjuku-ku | Bunkyo-ku
- Tokyo South submarket:Shinagawa-ku | Meguro-ku | Setagaya-ku | Ota-ku
- Tokyo North / West submarket:Suginami-ku | Nakano-ku | Nerima-ku | Toshima-ku | Itabashi-ku | Kita-ku | Taito-kuz
- Tokyo East submarket:Koto-ku Sumida-ku | Arakawa-ku | Edogawa-ku | Katsushika-ku | Adachi-ku
- Yokohama / Kawasaki region:Yokohama-shi | Kawasaki-shi
Detailed descriptions
- Pick Up Area:For investment real estate, trends in the average gross yields based on contract price and initial asking price, together with the number of closed contracts by submarkets are represented in the graph. The details of the transition of actual market value and properties both for sale and sold in certain neighborhoods are also shown.
- Market Overview :As an overview of all the submarkets, the trend from the past to this fourth quarter is available. Trends in the average gross yields based on contract price and initial asking price together with the number of closed contracts by area are shown for comparison.
[Source of data] The information is drawn from the database concerning marketed properties and concluded contracts by Mitsui Fudosan Realty Network (En-bloc condominiums / office buildings / apartment buildings).
- The number of closed contracts and average gross yield based on contract price: Contracts closed in a quarter (three months) and the average gross yield (including estimated values)
- Average gross yield based on initial asking price: Quarterly average gross yield of closed contracts based on initial asking price
* The trend of each graph represents indices based on values for the first quarter of 2012 set at 100. (Average gross yield based on contract price is shown as an index to average gross yield based on initial asking price for first quarter of 2012 set at 100.) [Note] The historical data may change subsequently because of continuous maintenance as updated data are newly acquired.
Tokyo Central submarket
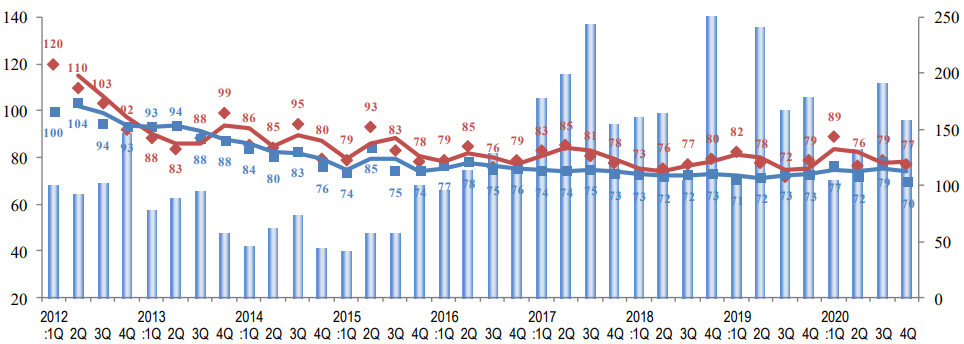
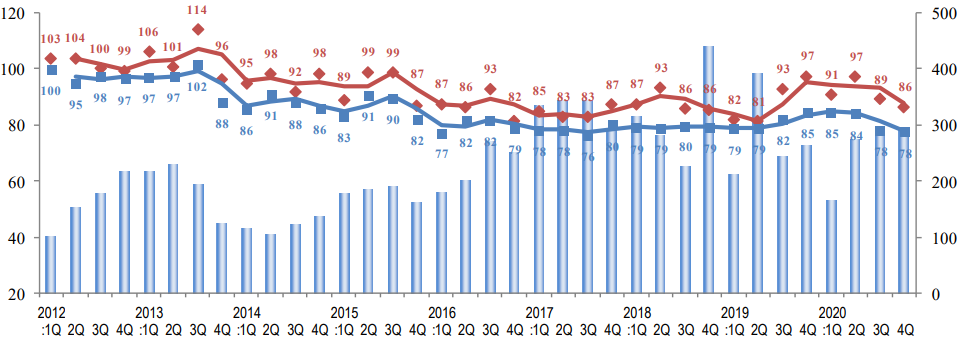
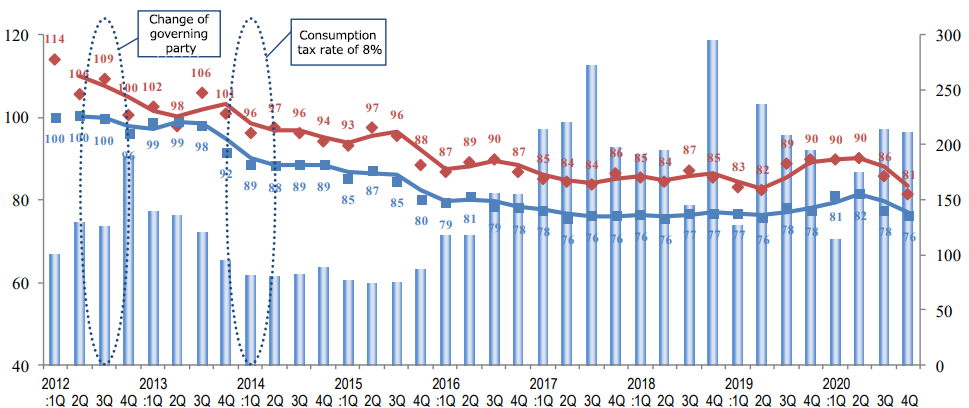
(*) Tokyo Central submarket: Minato-ku, Chiyoda-ku, Chuo-ku, Shibuya-ku, Shinjuku-ku, and Bunkyo-ku ◆Trends in the quarterly average gross yields based on contract price and initial asking price together with the number of closed contracts
(Index: 1Q 2021 yield on initial asking price = 100 ◆ Average gross yield based on contract price ■ Average gross yield based on initial asking price)
Brokered transactions of investment real estate in certain neighborhoods
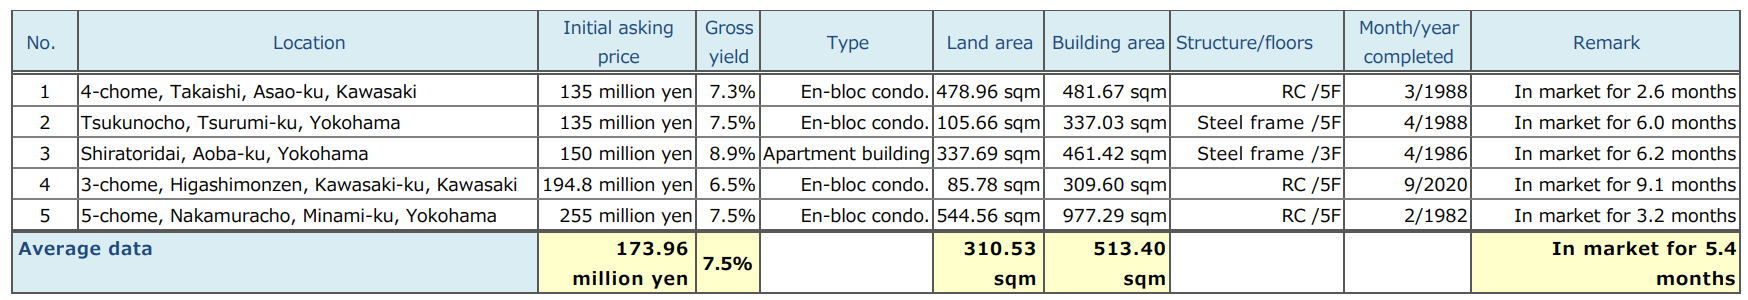
[For sale properties] * Partially extracted
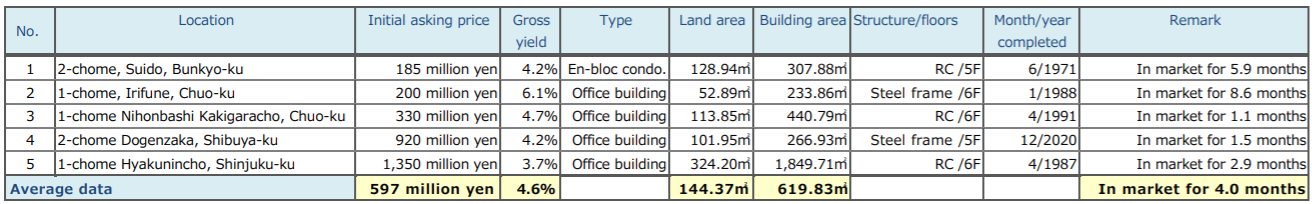
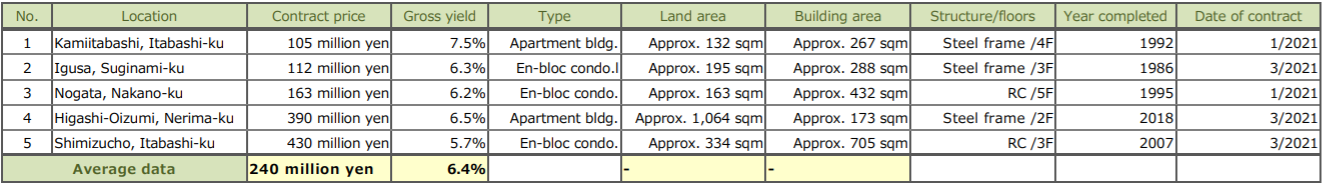
[Sold properties] * Partially extracted
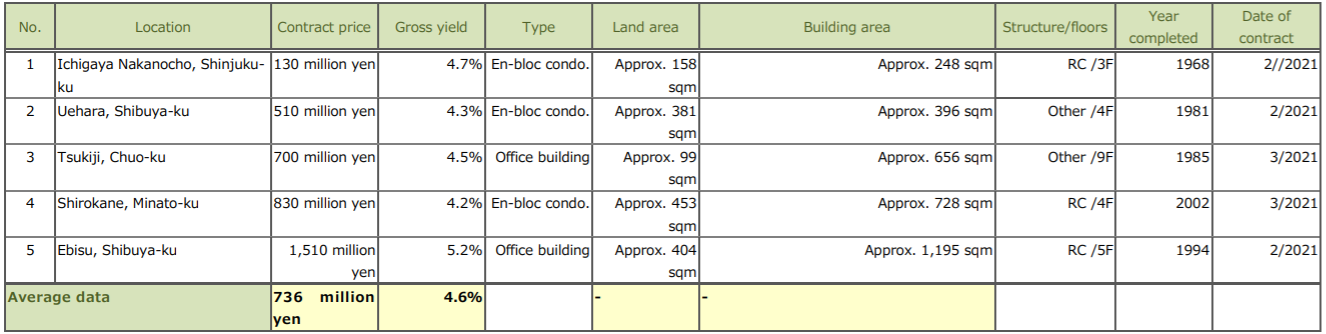
The number of transactions in 4Q FY 2020 returned to a pre-COVID-19 level. While average gross yield on initial asking price remained largely unchanged QoQ, average gross yield on contract price was down 5.5 pt (i.e., prices were up) QoQ, to a level below average gross yield on initial asking price. This is a sign that market conditions in the Central submarket are firm at present. It is increasing demand from investors that is contributing to such favorable conditions. Appetite for real estate acquisition is growing among a wide range of players, including investment funds and REITs with abundant funding, real estate firms lacking sufficient stocks of properties for sale, general business corporations seeking to make up for a slump in their main business domains with real estate investment, and wealthy individuals benefiting from rising stock markets. Besides, there is always a certain amount of demand as a countermeasure against estate taxes from wealthy families. These motivated buyers from various backgrounds are buoying market sentiment, by, in increasingly many cases, purchasing low-yield properties to pursue good locations and large-scale deals. At the same time, a growing number of property owners are moving to sell properties, thinking it is a good time to sell. Condition of the seller's market, however, is still expected to continue in the future, supported by solid demand for properties in the Central submarket, and high-quality properties are likely to be contracted at even higher prices. However, there also are several grounds for concern that could make the current favorable market conditions short-lived, such as repercussions from the third declaration of the state of emergency and the possibility of faltering economy due to COVID-19. It will be essential to continue closely monitoring the various economic impacts of COVID-19 and changes in the market.
Tokyo Central submarket
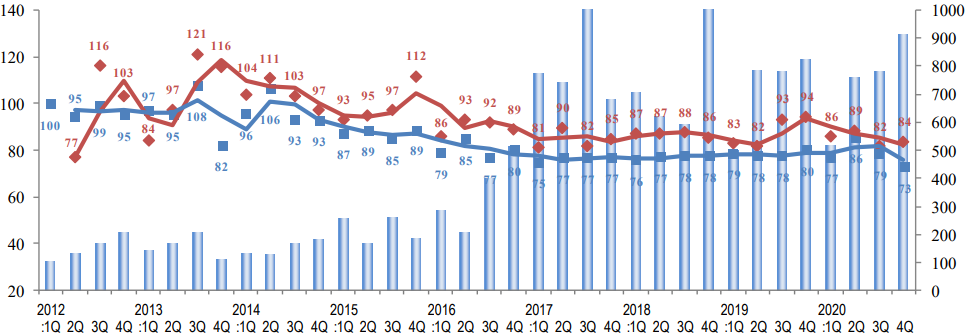
(*) Tokyo South submarket: Shinagawa-ku, Meguro-ku, Setagaya-ku, and Ota-ku
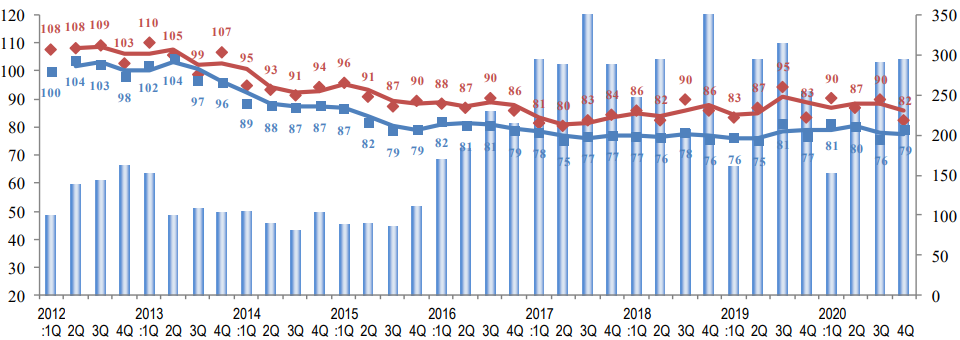
◆Trends in the quarterly average gross yields based on contract price and initial asking price together with the number of closed contracts
(Index: 1Q 2021 yield on initial asking price = 100 ◆ Average gross yield based on contract price ■ Average gross yield based on initial asking price)
(Index: 2012: 1Q = 100; # of closed contracts)
(Fiscal year/quarter)
Comparison with the previous period (3Q 2020)
Brokered transactions of investment real estate in certain neighborhoods
(*) Tokyo Central submarket: Minato-ku, Chiyoda-ku, Chuo-ku, Shibuya-ku, Shinjuku-ku, and Bunkyo-ku ◆Trends in the quart
[For sale properties] * Partially extracted
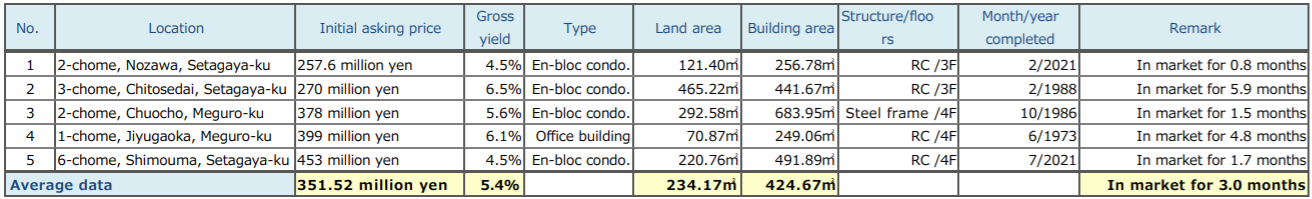
[Sold properties] * Partially extracted
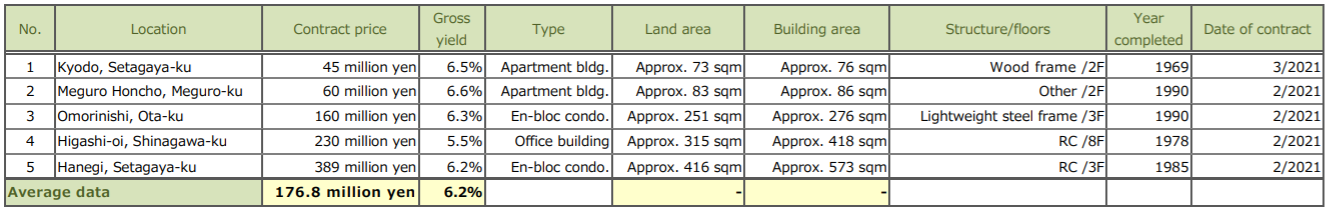
In this area in 4Q FY 2020, both average gross yield on contract price and average gross yield on initial asking price were down (i.e., prices rose). Average gross yield on contract price was 77 (down 1.8 pt QoQ), while average gross yield on initial asking price was 70 (down 8.9 pt QoQ). Average gross yield on initial asking price hit its lowest level since the survey began in 2012. While the number of contracts was up YoY (4Q FY 2019) in other areas, in this area results were down both YoY and QoQ (3Q FY 2020). This is thought to be due in part to the fact that average yield on initial asking price was down substantially (i.e., prices were up) by 8.9 pt QoQ, resulting in a wider gap from prospective buyers' expected yields, and making it more difficult to bring sellers and buyers together. The average gross yield on initial asking price in this submarket has remained steadily within the range of 70’s since 2015. The number of sales contracts will depend upon the number of properties coming on the market and the level of the gross yield on initial asking price, while investors’ demand is expected to stay vigorous in the future. It will remain essential to monitor closely trends in supply of properties for sale.
Tokyo North / West submarket
(*) Tokyo North / West submarket: Suginami-ku, Nakano-ku, Nerima-ku, Toshima-ku, Itabashi-ku, Kita-ku, and Taito-ku
◆Trends in the quarterly average gross yields based on contract price and initial asking price together with the number of closed contracts (Index: 1Q 2021 yield on initial asking price = 100 ◆ Average gross yield based on contract price ■ Average gross yield based on initial asking price)
(Index: 2012: 1Q = 100; # of closed contracts)
(Fiscal year/quarter)
Brokered transactions of investment real estate in certain neighborhoods
(*) Tokyo Central submarket: Minato-ku, Chiyoda-ku, Chuo-ku, Shibuya-ku, Shinjuku-ku, and Bunkyo-ku ◆Trends in the quart
[For sale properties] * Partially extracted
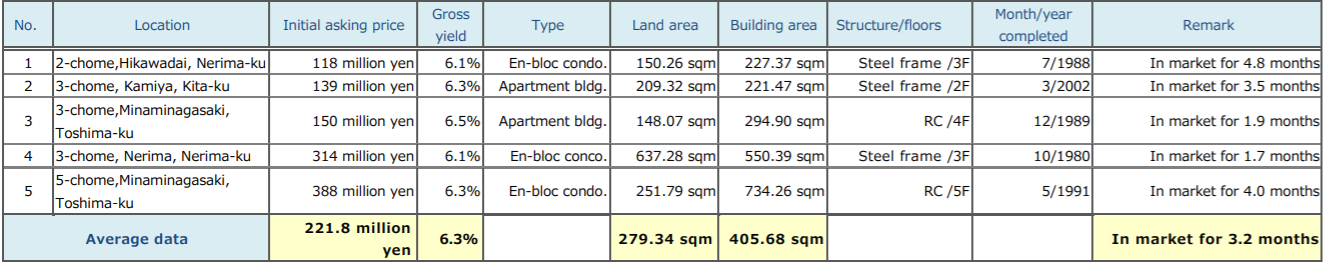
[Sold properties] * Partially extracted
The number of contracts in the Tokyo North / West submarket showed a slight increase QoQ in 4Q FY 2020. This is the third consecutive quarterly increase. While average gross yield on contract price was down 7.4 pt (i.e., prices rose) QoQ, average gross yield on initial asking price was up 3.5 pt (i.e., prices fell), narrowing the gap between the two. Most of real estate companies, who took a wait-and-see attitude and refrained from purchasing properties when the state of emergency was declared in April last year, switched to the offensive seeing the investment market for residential properties unscathed. This has driven up contract prices and led to an increasing trend in the number of contracts. As for commercial properties, such as retail and office buildings, investment appetite among real estate companies and individual investors may stay poor because of the impact from the third round of the state of emergency and the growing risk of lease termination and rent abatement by tenants under the circumstances the spread of mutating COVID-19 never seems to end. There will be a need to continue closely watching conditions, such as leasing market and transaction trends, with regard to commercial real estate investment.
Tokyo East submarket
(*) Tokyo East submarket: Koto-ku, Sumida-ku, Arakawa-ku, Edogawa-Ku, Katsushika-ku, and Adachi-ku ◆Trends in the quarterly average gross yields based on contract price and initial asking price together with the number of closed contracts
(Index: 1Q 2021 yield on initial asking price = 100 ◆ Average gross yield based on contract price ■ Average gross yield based on initial asking price)
(Index: 2012: 1Q = 100; # of closed contracts)

(Fiscal year/quarter)
Brokered transactions of investment real estate in certain neighborhoods
(*) Tokyo Central submarket: Minato-ku, Chiyoda-ku, Chuo-ku, Shibuya-ku, Shinjuku-ku, and Bunkyo-ku ◆Trends in the quart
[For sale properties] * Partially extracted
[Sold properties] * Partially extracted
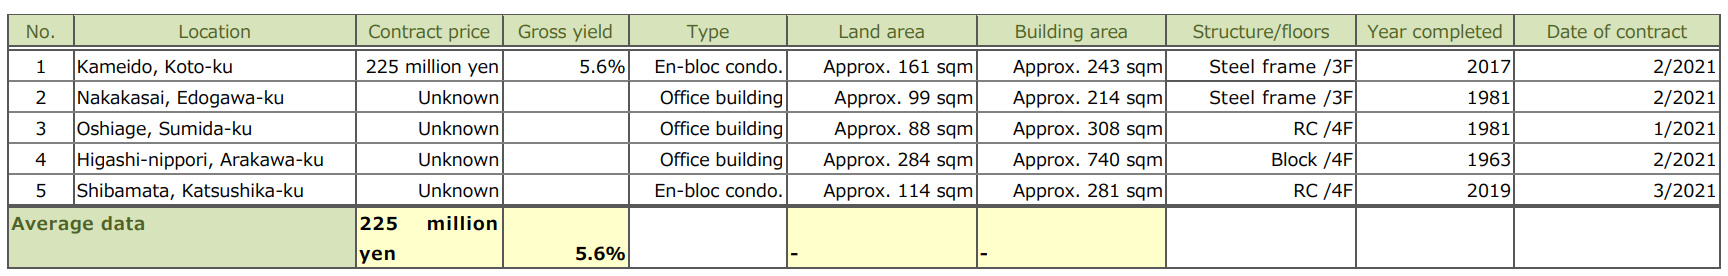
(*) Tokyo East submarket: Koto-ku, Sumida-ku, Arakawa-ku, Edogawa-Ku, Katsushika-ku, and Adachi-ku ◆The Tokyo East submarket in 4Q FY 2020 continued to show strength as much as in other years, barely affected by the second round of the state of emergency, and the number of contracts in this submarket went up YoY. It would appear that the COVID-19 pandemic has not caused too much of a disruption in the market condition, and that the Tokyo East submarket continues to be strong. There was a rising trend in offering prices, pushing average gross yield on initial asking price down to 73 (down 5.6pt QoQ), its lowest level since the survey began in 2012. Average gross yield on contract price, however, climbed to 84 (up 2.0 pt QoQ). As a result, the spread between the bid and the ask prices widened. While demand remains strong for residential properties, which are less susceptible to the impact of COVID-19, interest among general real estate investors in the purchase of commercial properties, such as retail and office buildings, may wane due to such grounds for concern as discount on new lease rates and request for rent abatement by tenants. It will be essential to continue closely watching the future impacts of COVID-19 on the real estate market, including the ramifications of highly contagious variants and the third round of the state of emergency. in the quarterly average gross yields based on contract price and initial asking price together with the number of closed contracts (Index: 1Q 2021 yield on initial asking price = 100 ◆ Average gross yield based on contract price ■ Average gross yield based on initial asking price) (Index: 2012: 1Q = 100; # of closed contracts) (Fiscal year/quarter)
Yokohama / Kawasaki region
(*) Yokohama and Kawasaki region: Yokohama-shi, Kawasaki-shi ◆Trends in the quarterly average gross yields based on contract price and initial asking price together with the number of closed contracts
(Index: 1Q 2021 yield on initial asking price = 100 ◆ Average gross yield based on contract price ■ Average gross yield based on initial asking price)
(Index: 2012: 1Q = 100; # of closed contracts)
(Fiscal year/quarter)
Brokered transactions of investment real estate in certain neighborhoods
(*) Tokyo Central submarket: Minato-ku, Chiyoda-ku, Chuo-ku, Shibuya-ku, Shinjuku-ku, and Bunkyo-ku ◆Trends in the quart
[For sale properties] * Partially extracted
[Sold properties] * Partially extracted
The number of contracts in the Yokohama / Kawasaki region in 4Q FY 2020 was up slightly both QoQ and YoY, hovering around a high level since 2Q. In terms of gross yield, there was a slight decrease QoQ (i.e., prices rose) on the bases of both contract price and initial asking price, also evidencing the briskness of the real estate investment market despite uncertainty of the real economy. However, the submarket has been increasingly polarized as in certain cases properties of a lesser quality such as those located in outer areas or far from railway stations, and those simply too old, have changed hands at yields of more than 10% when sellers have accepted significant discounts for the sake of quick sales. As far as the demand-supply situation is concerned, there is a growing demand to buy with increasing inflow of investment money, which is also apparent in stock price trends, while the number of properties coming on the market is limited. It would appear that property owners, despite misgivings about falling occupancy rates and rent levels, continue to take a wait-and-see attitude for the time being. It should not be overlooked such mismatch between demand and supply is affecting trends in the number of contracts and yields. It will be necessary to pay even closer attention to how the third round of the state of emergency will impact the market at the start of the fiscal year, as well as trends in economic conditions, stock prices, and money market.
General overview
General ◆Trends in the quarterly average gross yields based on contract price and initial asking price together with the number of closed contracts/ All Five submarkets (Index: 1Q 2021 yield on sales = 100 ◆ Average gross yield based on contract price ■ Average gross yield based on initial asking price) (Index: 2012: 1Q = 100; # of closed contracts)
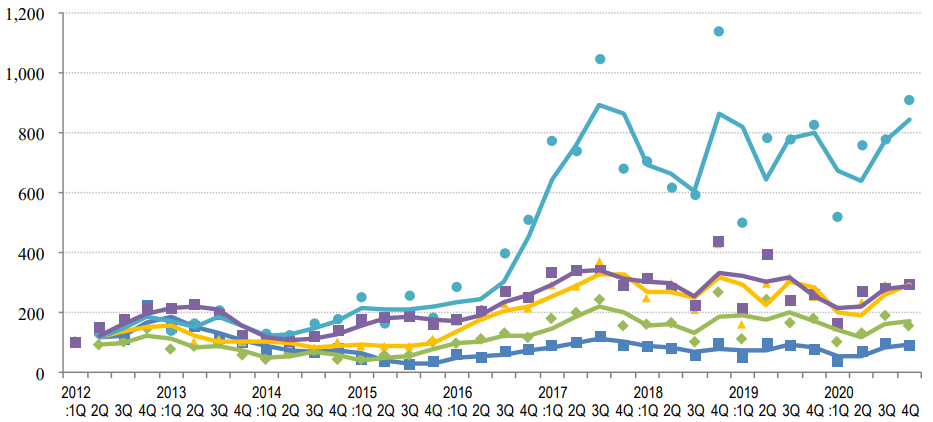
- Tokyo Central submarket
- Tokyo South submarket
- Tokyo North / West submarket
- Tokyo East submarket
- Yokohama / Kawasaki region
Trend in average gross yield based on initial asking price by submarkets
(Index: 2012: 1Q = 100 Average gross yield based on initial asking price) }
(Fiscal year/quarter)
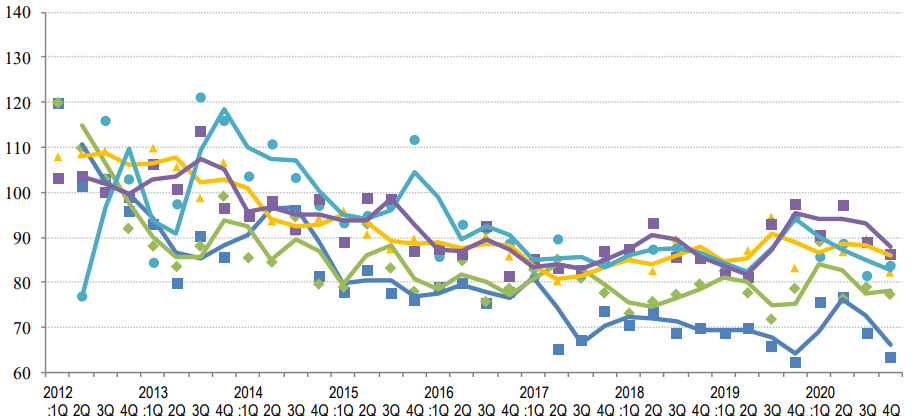
◆Trend in average gross yield based on initial asking price by submarkets
(Index: 2012: 1Q = 100 Average gross yield based on initial asking price)
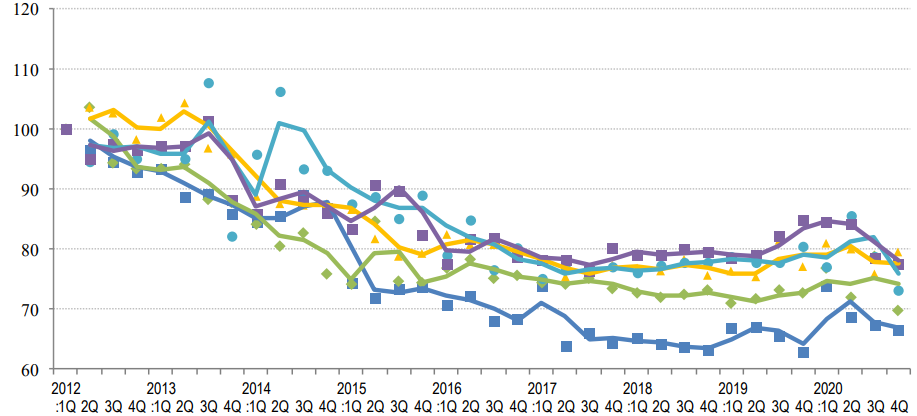
(Fiscal year/quarter)
- Tokyo Central submarket
- Tokyo South submarket
- Tokyo North / West submarket
- Tokyo East submarket
- Yokohama / Kawasaki region
The number of transactions in this quarter was down slightly QoQ overall. It rose QoQ in the Tokyo East submarket and slightly in the Tokyo North / West submarket and the Yokohama / Kawasaki region, while it fell in the Tokyo Central and Tokyo South submarkets.
The average gross yield on contract price was down (i.e., prices rose) in the Tokyo Central, Tokyo South, and Tokyo North / West submarkets and in the Yokohama / Kawasaki region, while it rose (i.e., prices fell) in the Tokyo East submarket. As for the Tokyo Central submarket, it became stronger than the last quarter when its strength was already standing out and turned to a seller’s market this quarter when the average gross yield on contract price fell below the average gross yield on initial asking price.
As for all the submarkets, sellers also seem to have the upper hand as the average gross yield on initial asking price was compressed in the three submarket except for the Tokyo North / West submarket and the Tokyo Central submarket where it either went up or stayed unchanged, respectively. A year has passed since the first round of the state of emergency was declared last spring.
Now, market conditions for the investment real estate are improving, especially for those located in the urban areas and/or high-priced properties much sought after. On the other hand, it must not be overlooked that the impact of COVID-19 on economic activity is affecting a certain kind of residential properties, such as low-end homes for actual demand the price level for which is showing bearish tendencies.