Our Site uses cookies to improve your experience on our website. For more details, please read our Cookie Policy.
By closing this message or starting to navigate on this website, you agree to our use of cookies.
Our Site uses cookies to improve your experience on our website. For more details, please read our Cookie Policy.
By closing this message or starting to navigate on this website, you agree to our use of cookies.


Contact
Mitsui Fudosan Realty can provide a wide range of real estate services on both investment and residential properties.
Please feel free to give us a call or contact with mail inquiry.
Phone
- China400-120-1319
- HongKong800-93-3060
- Taiwan00801-81-2728
- Japan0120-923-431
- Other Regions+81-3-6758-4072

Investment Real Estate Market Report | 1Q FY 2021

Foreword
Thank you very much for your continued support and business. At Mitsui Fudosan Realty, we have been providing a broad range of services in order for clients to make the “Best Use” of precious assets, and attentive consultation services about concerns and worries clients have with respect to assets in various conditions, not only through brokerage of business and investment properties but also by helping clients to utilize assets effectively for such purposes as estate and tax planning.
As part of these efforts, we prepare ‘Investment Real Estate Market Report’ for reference to help clients grasp the situation affecting real estate holdings. Since the investment real estate market is susceptible to external factors such as an economic trend, an objective point of view is essential to understand the current market conditions. It is our great pleasure if this report is instrumental for readers to develop asset-building strategies.
We will continue striving to deliver long-term support through development, implementation, and follow-up of plans that will satisfy clients, meet demands of each client on one-on-one basis by making the most of professional expertise and experience gained over the years, and prove worthy of clients’ trust. Please feel free to contact us at the office below with any comments or requests concerning this report or any real-estate related matters. We look forward to the pleasure of serving you again.
Mitsui Fudosan Realty Co., Ltd.
Solution Business Division
■Toll-free Number: 0120-321-376
■Hours: 9:30 am - 6:00 pm Closed Saturdays, Sundays, and holidays
■3-2-5, Kasumigaseki, Chiyoda-ku, Tokyo 100-6019, Japan
We at Solution Business Division of Mitsui Fudosan Realty Co., Ltd. prepare ‘Investment Real Estate Market Report’ to help clients develop a medium-to-long term plan for asset building. Please also take a look at our website, which is full of useful information such as properties for sale, various consultation services, and articles by real estate experts.
Areas subject to collection of data
- Tokyo Central submarket:Minato-ku, Chiyoda-ku, Chuo-ku, Shibuya-ku, Shinjuku-ku, and Bunkyo-ku
- Tokyo South submarket:Shinagawa-ku, Meguro-ku, Setagaya-ku, and Ota-ku
- Tokyo North / West submarket:Suginami-ku, Nakano-ku, Nerima-ku, Toshima-ku, Itabashi-ku, Kita-ku, and Taito-ku
- Tokyo East submarket:Koto-ku, Sumida-ku, Arakawa-ku, Edogawa-ku, Katsushika-ku, and Adachi-ku
- Yokohama / Kawasaki region:Yokohama city and Kawasaki city
Detailed descriptions
- Pick Up Area:For investment real estate, trends in the average gross yields on contract price and initial asking price, together with the number of closed contracts by submarkets are represented in the graph. The details of the transition of actual market value and properties both for sale and sold in certain neighborhoods are also shown.
- Market Overview:As an overview of all the submarkets, the trend from the past to this quarter is available. Trends in the average gross yields based on contract price and initial asking price together with the number of closed contracts by area are shown for comparison.
[Source of data]The information is drawn from the database concerning marketed properties and concluded contracts by Mitsui Fudosan Realty Network (En-bloc condominiums / office buildings / apartment buildings).
- The number of closed contracts and average gross yield on contract price: Contracts closed in a quarter (three months) and the average gross yield (including estimated values)
- Average gross yield on initial asking price: Quarterly average gross yield of closed contracts based on initial asking price
* The trend of each graph represents indices based on values for the first quarter of 2012 set at 100. (Average gross yield on contract price is shown as an index to average gross yield on initial asking price for the first quarter of 2012 set at 100.) [Note] The historical data may change subsequently because of continuous maintenance as updated data are newly acquired.
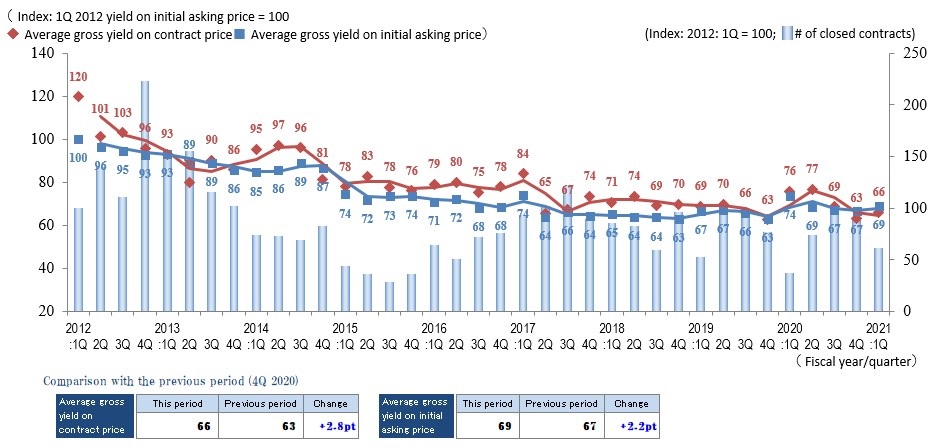
Pick Up Area -Tokyo Central submarket-
(*)Tokyo Central submarket: Minato-ku, Chiyoda-ku, Chuo-ku, Shibuya-ku, Shinjuku-ku, and Bunkyo-ku
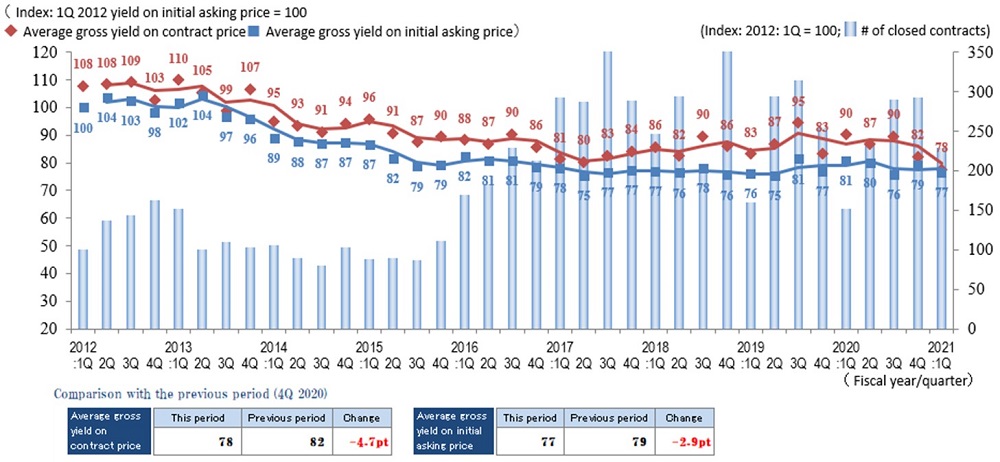
◆Trends in the quarterly average gross yields based on contract price and initial asking price together with the number of closed contracts
◆Brokered transactions of investment real estate in certain neighborhoods
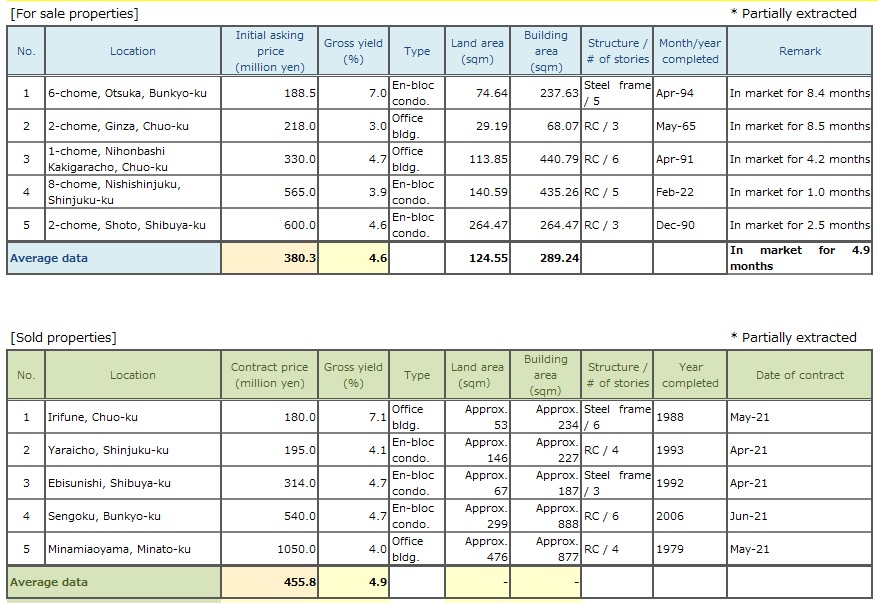
The number of transactions in 1Q / FY2021 returned to the same level as in a normal year before the coronavirus disaster. As for yields, the average gross yield on initial asking price increased by +0.2% (price decreased), and the average gross yield on contract price increased by +0.3% (price decreased) from the previous quarter.
Since the average gross yield on contract price is lower than the average gross yield on initial asking price, the Central submarket remains in the state of a "seller's market." Both yields, however, inched up a bit from the last quarter. So overall prices are on a downward trend, mainly because there have been an increasing number of cases where sellers end up lowering aggressive asking prices after facing difficulty to find takers. Prime properties that are hard to come by, however, are selling at premium. We will see greater variances in sales performance and contract pricing from property to property in the future.
That said, it will be a good time to sell properties and achieve high prices in the Central submarket based on mid- and long-term perspectives. And It is necessary to carefully watch the market condition from 2Q on and see whether the increase in yields on both initial asking price and contract price (or falling prices) observed in this survey indicates a turning point for the thriving Central submarket which has recovered quickly on the rebound from the state of "self-restraint" following COVID-19 outbreak last year.
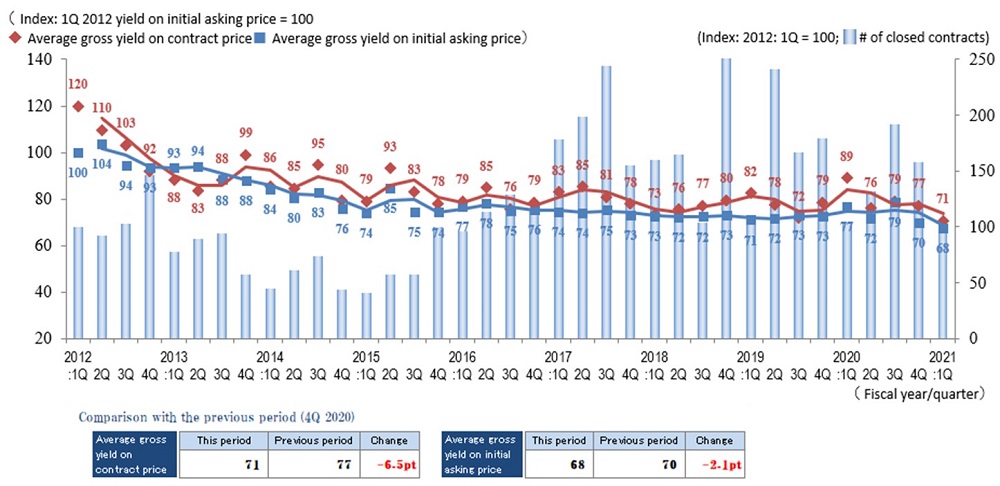
Pick Up Area -Tokyo South submarket-
(*) Tokyo South submarket: Shinagawa-ku, Meguro-ku, Setagaya-ku, and Ota-ku
◆Trends in the quarterly average gross yields based on contract price and initial asking price together with the number of closed contracts
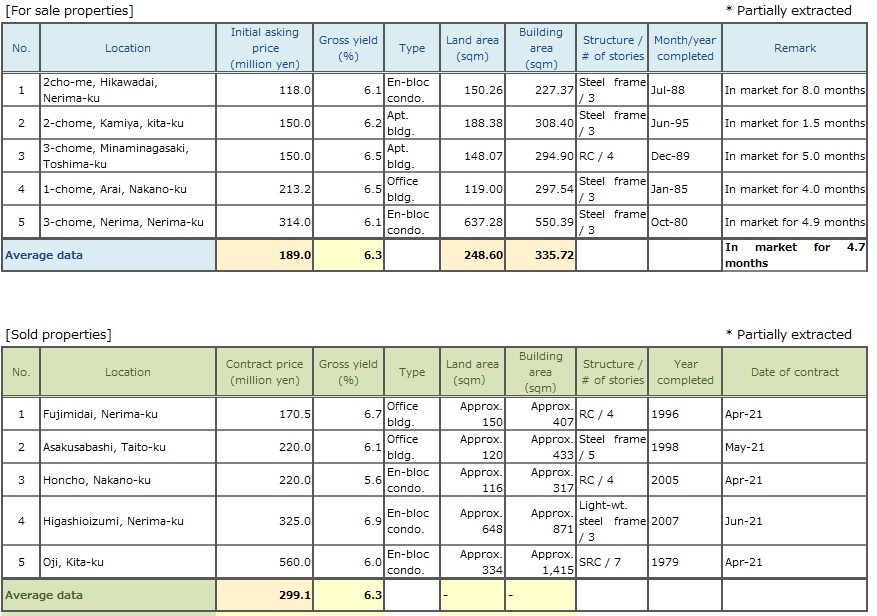
◆Brokered transactions of investment real estate in certain neighborhoods
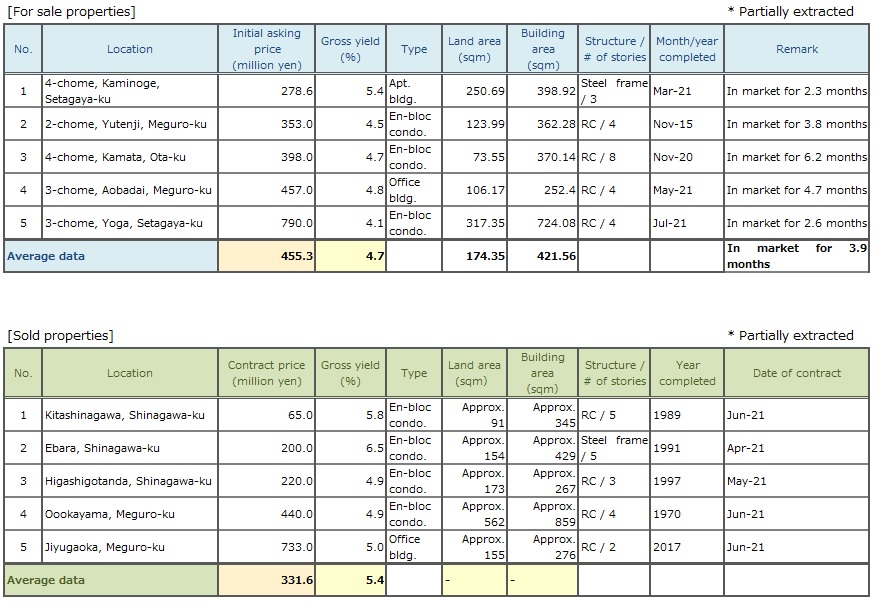
In 1Q / 2021, the average gross yield on contract price and the average gross yield on initial asking price in this submarket fell (prices rose) to 5.6% (down 0.5% from the previous quarter) and 5.4% (down 0.2% from the previous quarter) respectively. The average gross yield on initial asking price of "5.4%" is a record low since the survey began in 2012. While the number of transactions in other submarkets was higher than in the same period last year (1Q / 2020) when the number of transactions waned due to the coronavirus pandemic, the result in this submarket was lower than either the same period last year or last quarter (4Q / 2020). One of the reasons for the sluggish number of transactions is that the shrinkage in the average gross yield on initial asking price (5.4%) to a level even lower than "5.5%" in the Central submarket (price rose) has widened a gap from the expected yield of prospective buyers, which in turn has made it difficult to match sellers and buyers.
In the submarket, usually the average gross yield on initial asking price has been consistently in the range of 5.7-6.2% since 2015. Now that it has fallen to the low 5% level, there is a concern that the transaction volume may be depressed for the time being. It will be necessary to pay close attention to the number of ‘For sale’ properties coming on market and the level of gross yields on their asking prices.
Pick Up Area -Tokyo North / West submarket-
(*) Tokyo North / West submarket: Suginami-ku, Nakano-ku, Nerima-ku, Toshima-ku, Itabashi-ku, Kita-ku, and Taito-ku
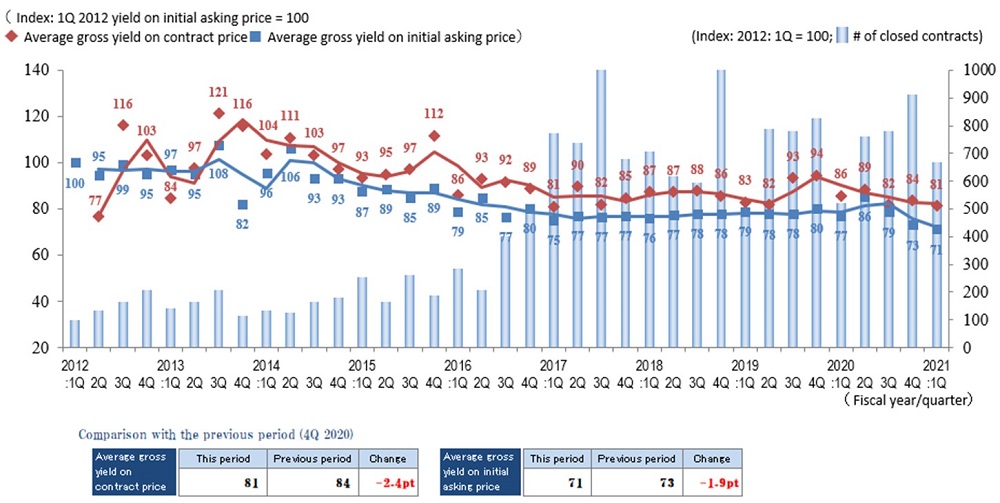
◆Trends in the quarterly average gross yields based on contract price and initial asking price together with the number of closed contracts
◆Brokered transactions of investment real estate in certain neighborhoods
In 1Q / 2021, the average gross yield on contract price and the average gross yield on initial asking price in the North / West submarket fell (price rose) to approximately 6.3% (down 0.3% from the previous quarter) and approximately 6.2% (down 0.2% from the previous quarter), respectively. The average gross yield on contract price was the lowest since the study began in 2012. And the gap between the average gross yield on contract price and the average gross yield on initial asking price shrank to approximately 0.1% from approximately 1.1% in 3Q / 2020. Thus, market condition for investment real estate in this submarket is strong. A brisk demand to purchase must be one of the reasons behind such market condition.
However, the number of transactions, which was increasing for three consecutive quarters until last, declined in this quarter. So it warrants watching closely future changes in market conditions. The Tokyo Olympic Games were held under the 4th round of the state of emergency in July, and it is necessary to pay close attention to how the investment real estate market is affected from now on by the spread of the COVID-19 infection, of which there is no end in sight.
Pick Up Area -Tokyo East submarket-
(*) Tokyo East submarket: Koto-ku, Sumida-ku, Arakawa-ku, Edogawa-Ku, Katsushika-ku, and Adachi-ku
◆Trends in the quarterly average gross yields based on contract price and initial asking price together with the number of closed contracts
◆Brokered transactions of investment real estate in certain neighborhoods
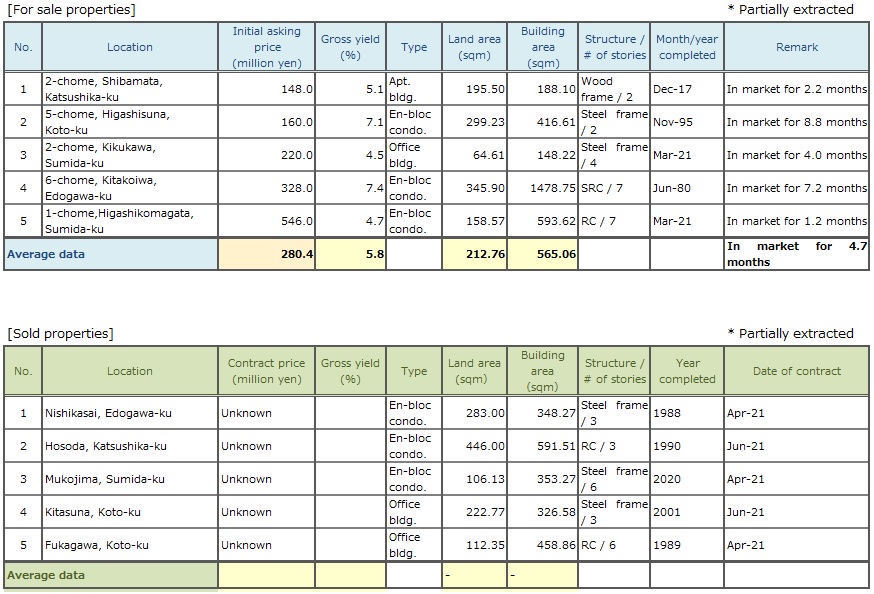
The number of contracts in the Tokyo East submarket in 1Q / 2021 was little affected by the third round of the state of emergency declared, and higher than in the same period of the previous year. Despite the COVID-19 pandemic, the real estate market in the eastern part of the city has not undergone any major disruptions and is expected to continue to perform well. The average gross yield on initial asking price and the average gross yield on contract price came down QoQ and YoY to 6.2% (down 0.2% from the previous quarter) and 7.1% (down 0.2% from the previous quarter), respectively, which were record lows since the survey began in 2012. It appears quality assets with such attributes as proximity to a station, large scale, and / or high visibility sell at a premium.
Residential properties are consistently sought after, because they are hardly susceptible to repercussions of the coronavirus. However, since a supply of studio-type and 1 bedroom units for singles is about to exceed demand in this submarket, it may be necessary in certain cases to allow for a longer period of time in leasing and / or revision of a rent level.
As for business assets such as commercial and office buildings are concerned, investors’ appetite seems to be on the wane due to a declining trend of new contract rents. It will be essential to continue closely watching the impacts of a highly contagious mutant strain and the fourth declaration of the state of emergency upon the real estate market here .
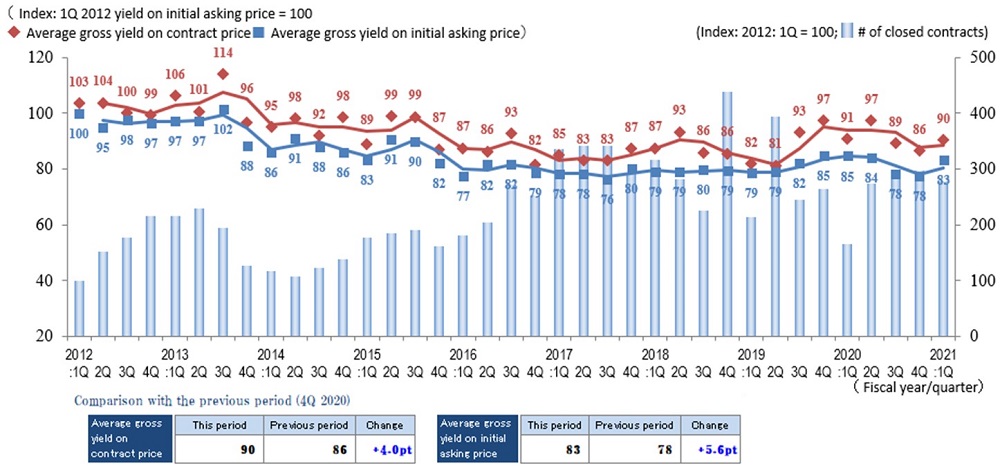
Pick Up Area -Yokohama / Kawasaki region-
(*) Yokohama and Kawasaki region: Yokohama city, Kawasaki city
◆Trends in the quarterly average gross yields based on contract price and initial asking price together with the number of closed contracts
◆Brokered transactions of investment real estate in certain neighborhoods
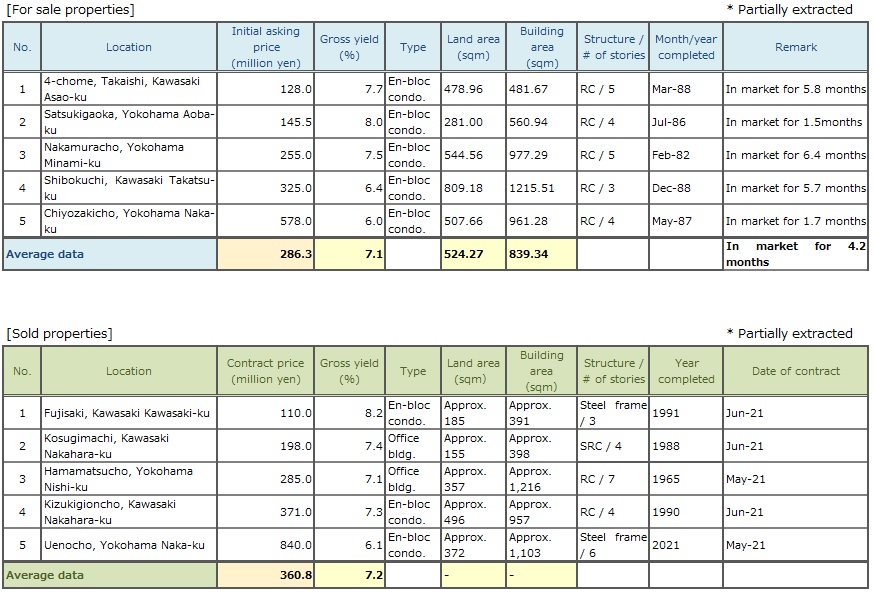
The 1Q / 2021 number of transactions in the Yokohama and Kawasaki region fell slightly QoQ. It was, however, significantly higher than in the same period of the previous year, and maintained the level as high as the second half of the previous year.
Gross yields, both on contract price and initial asking price inched up (prices fell) on average QoQ, but the investment real estate market remained vibrant.
However, this region has been increasingly polarized as in certain cases marginal properties such as those located in outer areas, or far from railway stations, and those simply too old, have changed hands at yields exceeding 10% when sellers accepted significant discounts for the sake of quick sales.
As far as the demand-supply situation is concerned, there continues a growing demand to buy with the active inflow of investment money, while the number of properties coming on the market remains limited. Owners of properties, commercial and office rather than residential, seem to be taking a wait-and-see attitude for a while more despite misgivings about falling occupancy rates and rent levels. It should not be overlooked such mismatch between supply and demand is affecting trends in the number of contracts and yields.
It will be necessary to pay even closer attention to how the fifth wave of COVID-19 infection is contained aided by the progress of vaccination, as well as trends in economic conditions.
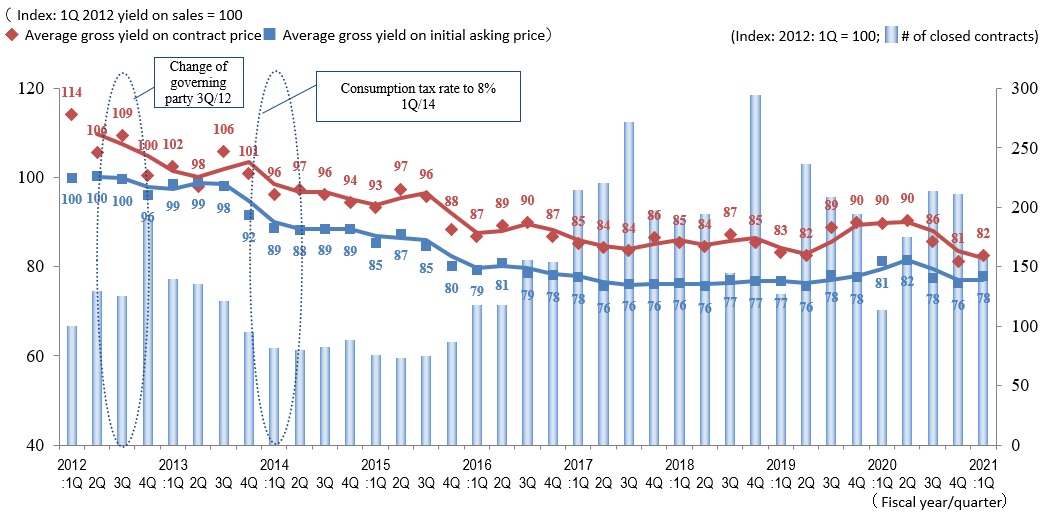
General overview
◆Trends in the quarterly average gross yield on contract price and initial asking price together with the number of transactions for the 4 submarkets and 1 region combined
◆Changes in the number of transactions by area
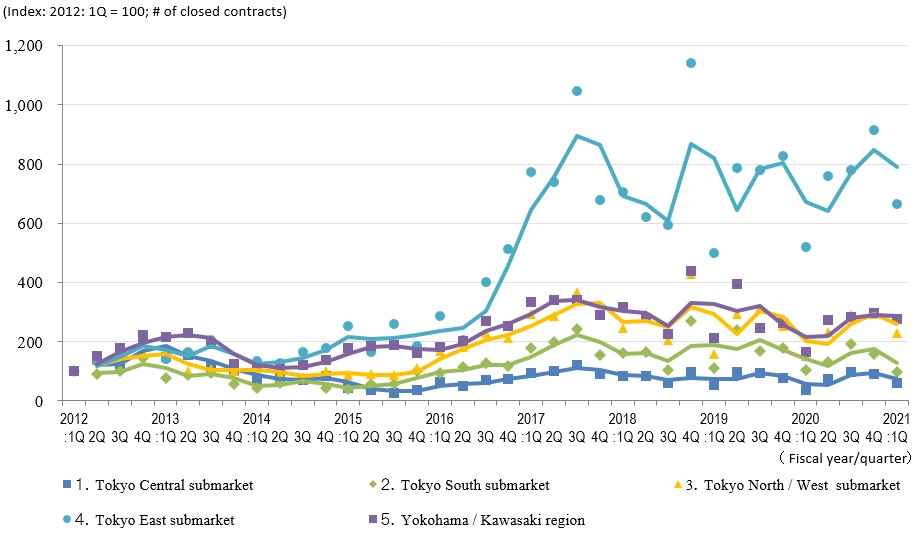
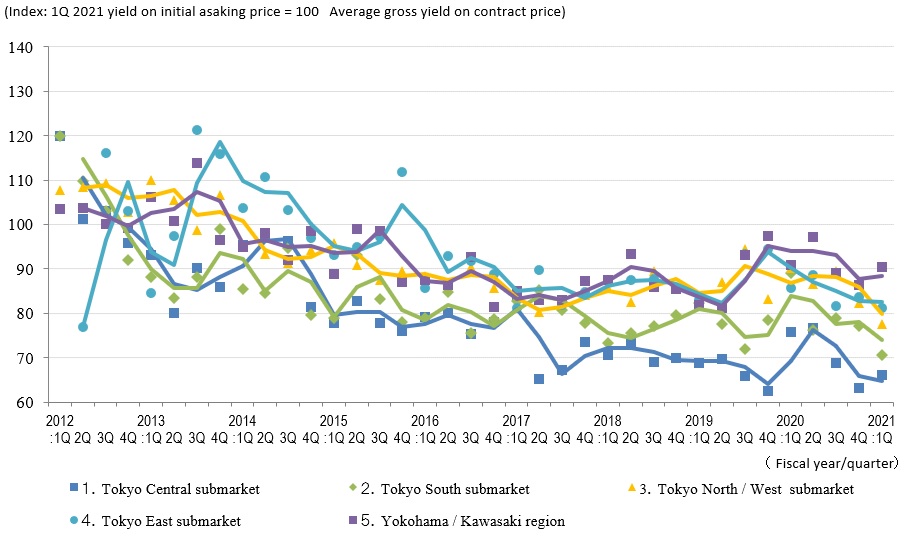
◆Trends in the average gross yield on contract price by area
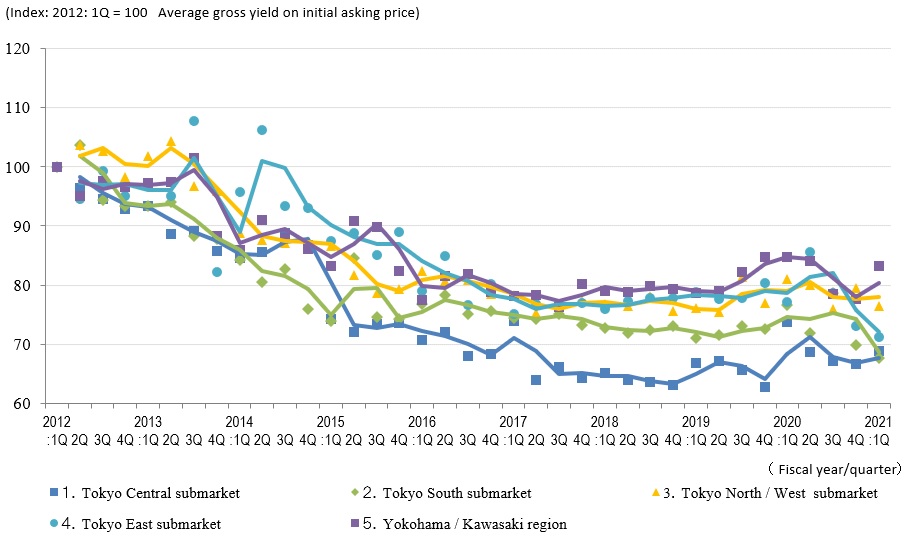
◆Trends in the average gross yield on initial asking price by area
The transaction volume for the quarter was down slightly QoQ overall.
However, it can be said that the investment real estate market this quarter has significantly improved from 1Q / 2020 since the first quarter is usually the slowest in a year and this quarter’s volume has exceeded the level of 1Q / 2019, when impact of COVID-19 was not present, yet .
Average gross yield on contract price rose (prices fell) in the Central submarket and Yokohama / Kawasaki region, whereas it fell (prices rose) in the South, North / West, and East submarkets. It is well worth noting that the average gross yield on initial asking price in the South submarket went below that in the Central submarket in this quarter. It was only in the South submarket that the number of transactions recorded a YoY drop from 1Q / 2020. There must have been too wide a gap to fill in pricing between sellers and buyers.
It is still a seller’s market in the Tokyo Central submarket, where the average gross yield on contract price fell below the average gross yield on initial asking price for two quarters in a row. Although the yield slightly increased and prices fell, the level of yield on contract price is on a par with that of FY2018 and FY2019. Thus, prices are on the high side.
With the spread of the new coronavirus strain continuing and a lack of bright future prospects after fall, when the Tokyo Olympic and Paralympic Games conclude, the economic outlook is likely to be increasingly unclear. As investment real estate is also expected to become more polarized, careful consideration should be given to either sale or purchase of properties, as further polarization of the investment real estate market is expected.