Our Site uses cookies to improve your experience on our website. For more details, please read our Cookie Policy.
By closing this message or starting to navigate on this website, you agree to our use of cookies.
Our Site uses cookies to improve your experience on our website. For more details, please read our Cookie Policy.
By closing this message or starting to navigate on this website, you agree to our use of cookies.


Contact
Mitsui Fudosan Realty can provide a wide range of real estate services on both investment and residential properties.
Please feel free to give us a call or contact with mail inquiry.
Phone
- China400-120-1319
- HongKong800-93-3060
- Taiwan00801-81-2728
- Japan0120-923-431
- Other Regions+81-3-6758-4072

Investment Real Estate Market Report | 3Q FY2022

Foreword
Thank you very much for your continued support and business.
We, at Mitsui Fudosan Realty, have been providing a broad range of services in order for our valued clients to make the "Best Use" of precious assets, and attentive consultation about concerns and worries clients have with respect to assets in various conditions, not only through brokerage of business and investment properties but also by helping clients to utilize assets effectively for such purposes as estate and tax planning.
As part of these efforts, we prepare an "Investment Real Estate Market Report" for reference to help clients grasp the situation affecting real estate holdings. Since the investment real estate market is susceptible to external factors such as economic trends, an objective point of view is essential to understand the current market conditions. It is our great pleasure if this report is instrumental for readers to develop asset building strategies.
We will continue striving to deliver long-term support through development, implementation, and follow-up of plans that will satisfy clients, meet demands of each client on a "one to one" basis by making the most of professional expertise and experience gained over the years, and prove worthy of clients' trust.
Please feel free to contact us at the office below with any comments or requests concerning this report, or any matters related to real estate assets.
We look forward to opportunities to serve you soon.
Mitsui Fudosan Realty Co., Ltd.
Solution Business Division
■Toll-free Number: 0120-321-376
■Hours: 9:30 am - 6:00 pm Closed Saturdays, Sundays, and holidays
■3-2-5, Kasumigaseki, Chiyoda-ku, Tokyo 100-6019, Japan
We, at Solution Business Division of Mitsui Fudosan Realty Co., Ltd., have been producing a "Investment Real Estate Market Report" to serve as an aid to hopefully assisting our valued clients formulate a medium-to long term asset building plan.
Please also take a look at our website, which is full of useful information such as properties for sale, various consultation services, and articles by real estate experts.
Areas subject to collection of data
Tokyo Central submarket: Minato-ku, Chiyoda-ku, Chuo-ku, Shibuya-ku, Shinjuku-ku, and Bunkyo-ku
Tokyo South submarket: Shinagawa-ku, Meguro-ku, Setagaya-ku, and Ota-ku
Tokyo North / West submarket: Suginami-ku, Nakano-ku, Nerima-ku, Toshima-ku, Itabashi-ku, Kita-ku, and Taito-ku
Tokyo East submarket: Koto-ku, Sumida-ku, Arakawa-ku, Edogawa-ku, Katsushika-ku, and Adachi-ku
Yokohama / Kawasaki region: Yokohama city and Kawasaki city
Detailed descriptions
Pick Up Area: For investment real estate, trends in the average gross yields on contract price and initial asking price, together with the number of closed contracts by submarkets are represented in the graph. The details of the transition of actual market value and properties both for sale and sold in certain neighborhoods are also shown.
Market Overview: As an overview of all the submarkets, the trend from the past to this quarter is available. Trends in the average gross yields based on contract price and initial asking price together with the number of closed contracts by area are shown for comparison.
Data Source: Information is extracted from the database containing properties offered for sale and contracts concluded through Mitsui Fudosan Realty Network (En-bloc condominiums / office buildings / apartment buildings).
- Number of Transactions & Average Gross Yield on Contract Price: Number of contracts closed in a quarter (three months) and average gross yield of them (including estimated values)
- Average Gross Yield on Initial Asking Price: Quarterly average gross yield of closed contracts based on their asking price initially quoted
*Figures in each chart represent indices based on values for 1Q / FY2017 set at 100.
(Average Gross Yield on Contract Price is shown as an index to Average Gross Yield on Initial Asking Price for 1Q / FY 2017 set at 100.)
[Note] The historical data may be revised subsequently due to maintenance carried out from time to time, such as adding newly acquired data.
Pick Up Area -Tokyo Central submarket-
(*)Tokyo Central submarket: Minato-ku, Chiyoda-ku, Chuo-ku, Shibuya-ku, Shinjuku-ku, and Bunkyo-ku
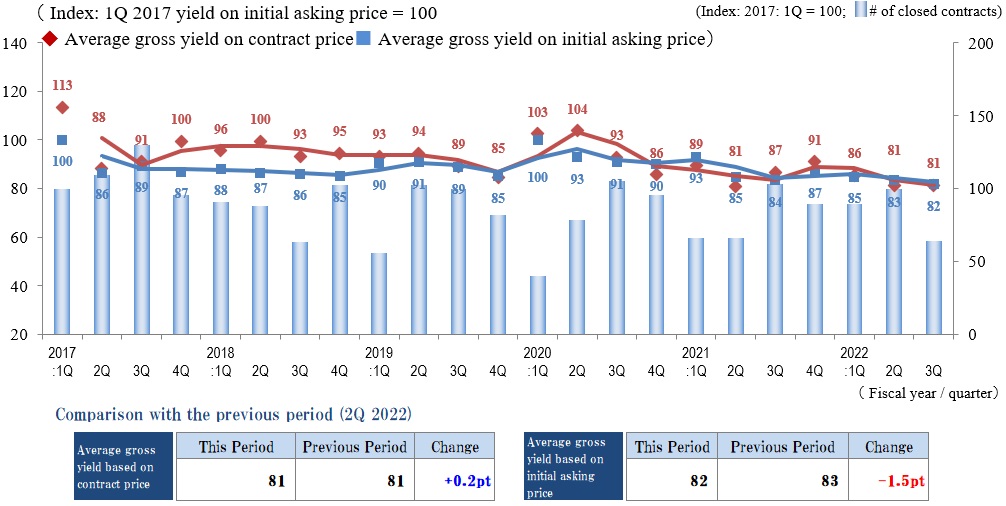
◆Movements by Quarter: Average Gross Yield on Contract Price / Average Gross Yield on Initial Asking Price / Number of Transactions
◆Brokered Transactions of Investment Real Estate in the Submarket
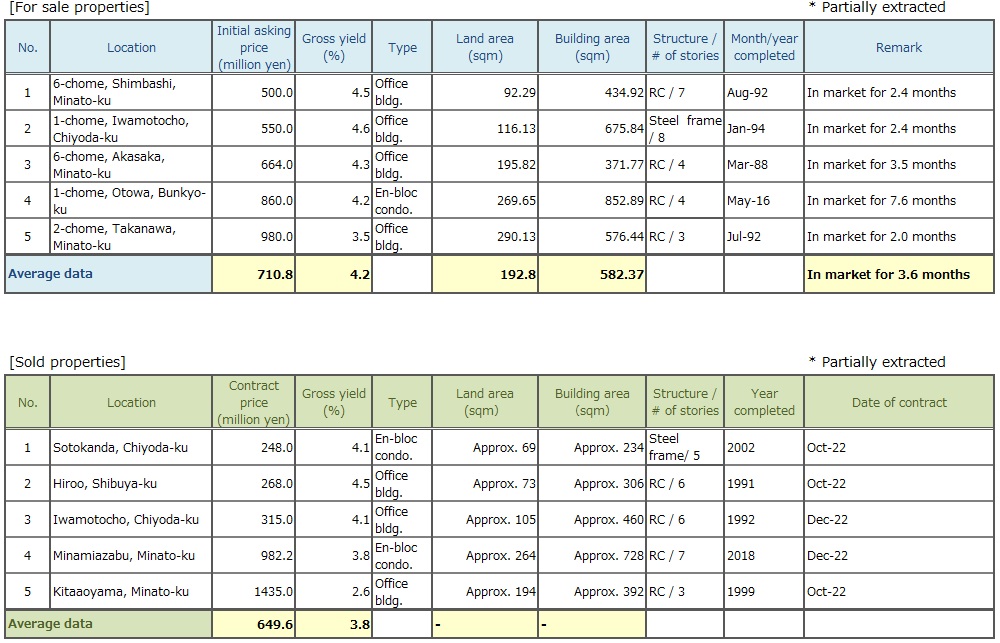
In Tokyo Central submarket, Index of Average Gross Yield on Contract Price for 3Q FY 2022 was fairly stable at 81 (up 0.2 pt QoQ), while Index of Average Gross Yield on Initial Asking Price for the same period fell by 0.15 pt to 82 (as prices increased).
Yields on both contract and initial asking prices have been trending at a low level (or prices have stayed high) since 1Q / FY2017, and there is no sign of upward shift in investors' expected yield here. However, there was a significant drop in Number of Transactions on both YoY and QoQ base. Taking into consideration Number of Transactions usually grows in 3Q and that movements of yields on both contract and initial asking prices have long been stable, the market may not be deemed thriving any more.
The reason for the decrease in Number of Transactions may be market participants' overreaction to the series of interest rate hikes in the United States to curb inflation and a de facto interest rate hike by the Bank of Japan in the wake of them.
As Tokyo Central submarket is expected to remain sensitive to uncertain economic conditions in the future, it is necessary to pay close attention to the movements in the Number of Transactions here as well as the market conditions in the outer peripheral areas of the city.
Pick Up Area -Tokyo South submarket-
(*) Tokyo South submarket: Shinagawa-ku, Meguro-ku, Setagaya-ku, and Ota-ku
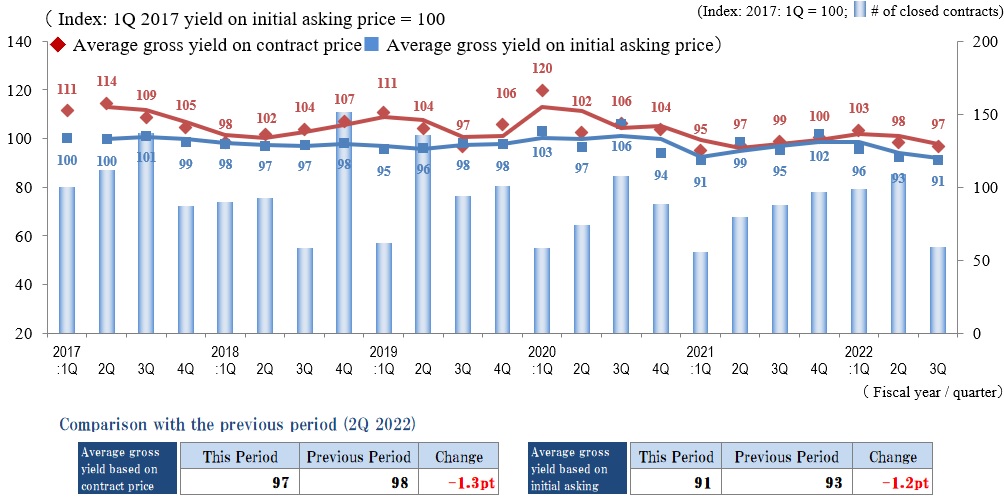
◆Movements by Quarter: Average Gross Yield on Contract Price / Average Gross Yield on Initial Asking Price / Number of Transactions
◆Brokered Transactions of Investment Real Estate in the Submarket
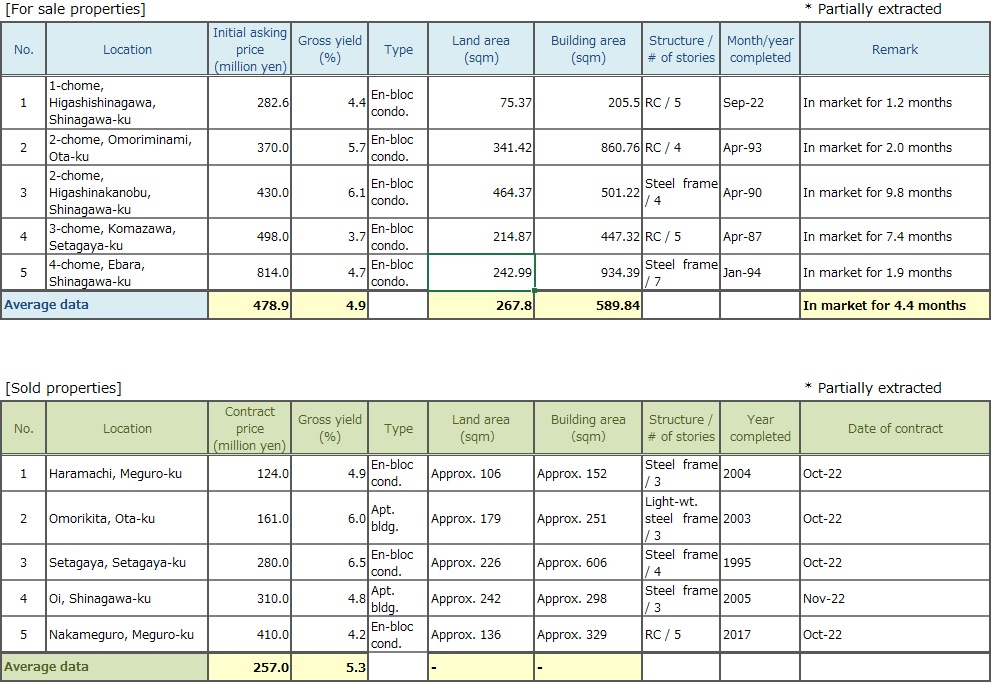
Index of Average Gross Yield on Contract Price here in 3Q FY2022 slid by 1.3 pt QoQ to 97. This was the second quarterly decline in a row due to an increase in the average contract price. Index of Average Gross Yield on Initial Asking Price also declined here (as the price rose) by 1.2 pt QoQ to 91. It is worthwhile to note that the index came down to the same level as the record low of 1Q FY2021 since the start of data collection in 1Q FY2017. Both Indices of Average Gross Yield on Contract Price and Average Gross Yield on Initial Asking Price declined, indicating that property prices remained high.
On the other hand, both numbers of properties offered for sale and actually sold were slightly diminishing. The decrease in Number of Transactions may be resulting simply from depletion in the number of properties put up for sale. In addition, the Number of Transactions may further dwindle possibly because of difficulty in dealmaking if lending rates rise and the gap between gross yield on initial asking price and investors' expected yield widens in the future. It is necessary to keep a close watch on the impact of interest rate trends and changes in investor sentiment on the real estate market.
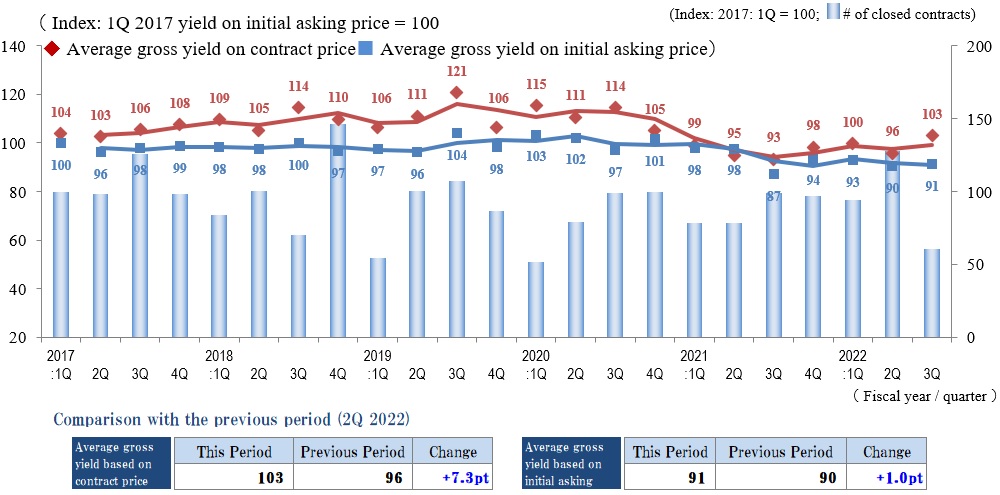
Pick Up Area -Tokyo North / West submarket-
(*) Tokyo North / West submarket: Suginami-ku, Nakano-ku, Nerima-ku, Toshima-ku, Itabashi-ku, Kita-ku, and Taito-ku
◆Movements by Quarter: Average Gross Yield on Contract Price / Average Gross Yield on Initial Asking Price / Number of Transactions
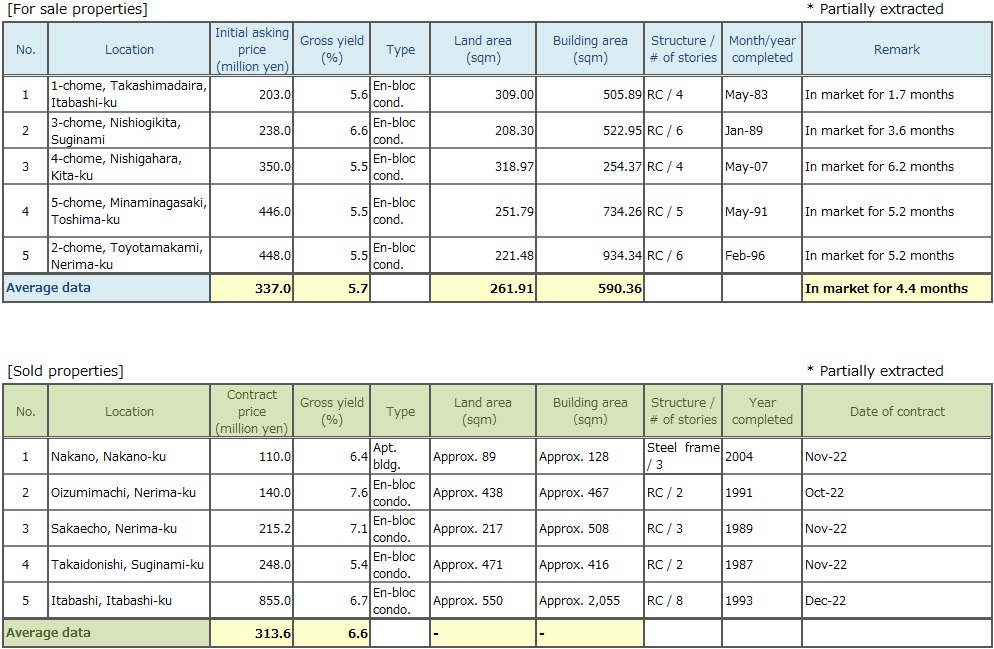
◆Brokered Transactions of Investment Real Estate in the Submarket
Number of Transactions here in 3Q FY2022 declined sharply QoQ to a level close to that of 1Q FY2020 when COVID-19 broke out. Indices of both Average Gross Yield on Contract Price and on Initial Asking Price climbed (as prices fell) to 103 (up 7.3 pt QoQ) and 91 (up 1.0 pt QoQ), respectively. In case of the Index of Average Gross Yield on Contract Price, it reached the highest level since 1Q FY2021. The gap between the two indices this quarter was the biggest since 4Q FY 2020, evidencing widening disparity between prices sellers want and buyers willing to pay.
The main reason for the opening gap was that buyers became increasingly cautious about a low level of yields on asking prices. As a result, the number of properties staying in the market for a long period of time has swollen, showing the sign this submarket has entered a phase of price adjustment.
Outlook for domestic economic conditions is opaque because of soaring prices, unstable exchange rates, an interest rate hike in the course of revision of a monetary relaxation policy by the Bank of Japan, and the replacement of its governor in April. These grounds for concern may affect investor confidence. Thus, it is necessary to carefully observe not only movements of property yields but also changes in economic situation.
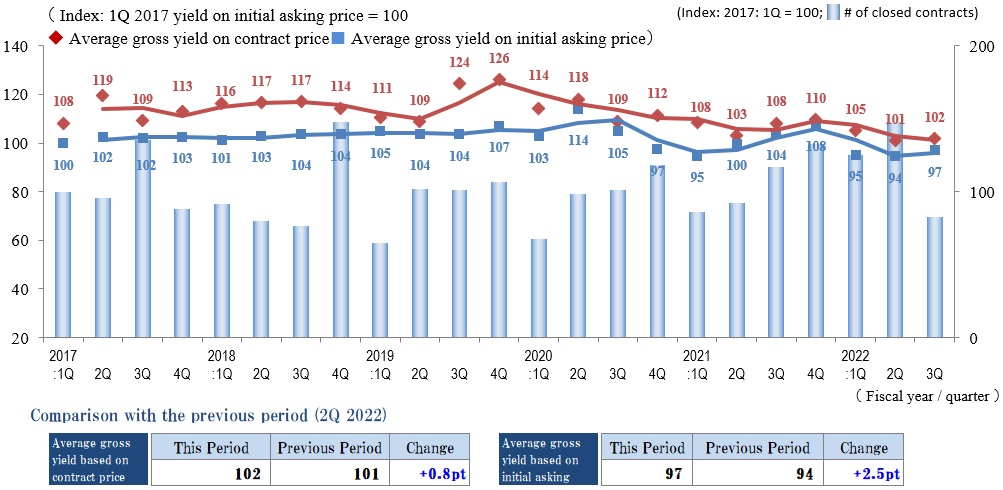
Pick Up Area -Tokyo East submarket-
(*) Tokyo East submarket: Koto-ku, Sumida-ku, Arakawa-ku, Edogawa-Ku, Katsushika-ku, and Adachi-ku
◆Movements by Quarter: Average Gross Yield on Contract Price / Average Gross Yield on Initial Asking Price / Number of Transactions
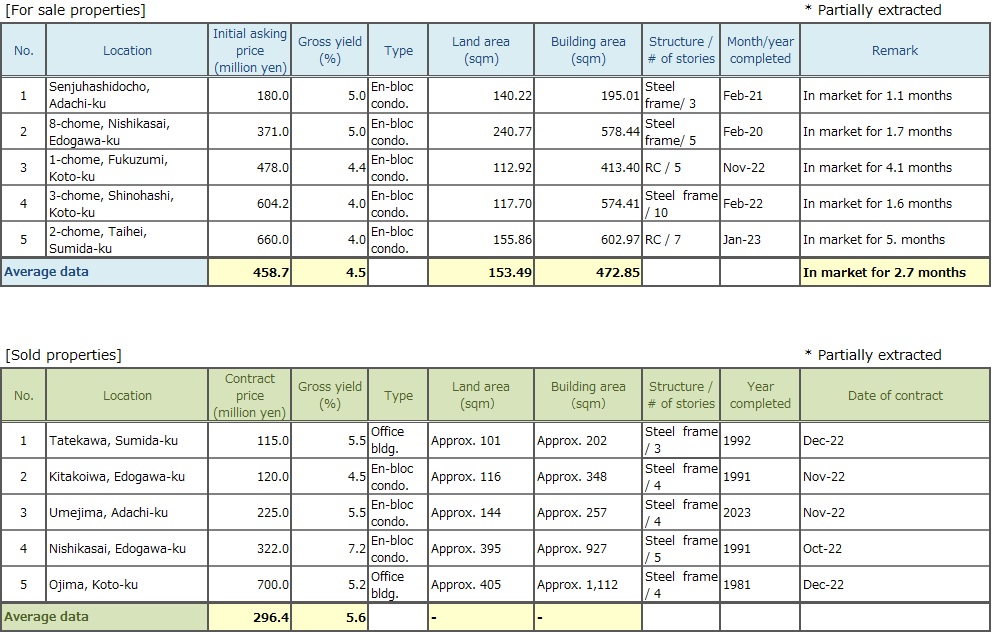
◆Brokered Transactions of Investment Real Estate in the Submarket
Number of Transactions here in 3Q FY2022 was significantly lower than that of year earlier. Indices of Average Gross Yield on Contract Price and on Initial Asking Price were 102 (up 0.8 pt QoQ as prices fell) and 97 (up 2.5 p QoQ also as prices fell). They were, however, within a close range from the record lows of 2Q FY2022 since the start of data collection in 1Q FY2017.
As a whole, investment property market here appears to be still solid without any turmoil while inbound demand from overseas investors is gradually spilling over to this submarket from the city center. However, investors' expected rate of return for properties old and obsolete, located far from stations or in suburban areas is creeping up. In case properties available for sale should stay unsold in the market for a prolonged period of time, this submarket might enter a period of adjustment, though there is no clear sign of it in terms of market activities or price levels yet.
There are a number of grounds for concern such as prolongation of conflict in Ukraine, interest rate hikes in the US, and rising prices of commodity and energy in Japan. A change of tide, whether property values go down because of them or stay unchanged in spite of them, may be coming soon. It must be appropriate to closely watch how this submarket will turn from now on.
Pick Up Area -Yokohama / Kawasaki region-
(*) Yokohama and Kawasaki region: Yokohama city, Kawasaki city
◆Movements by Quarter: Average Gross Yield on Contract Price / Average Gross Yield on Initial Asking Price / Number of Transactions
◆Brokered Transactions of Investment Real Estate in the Submarket
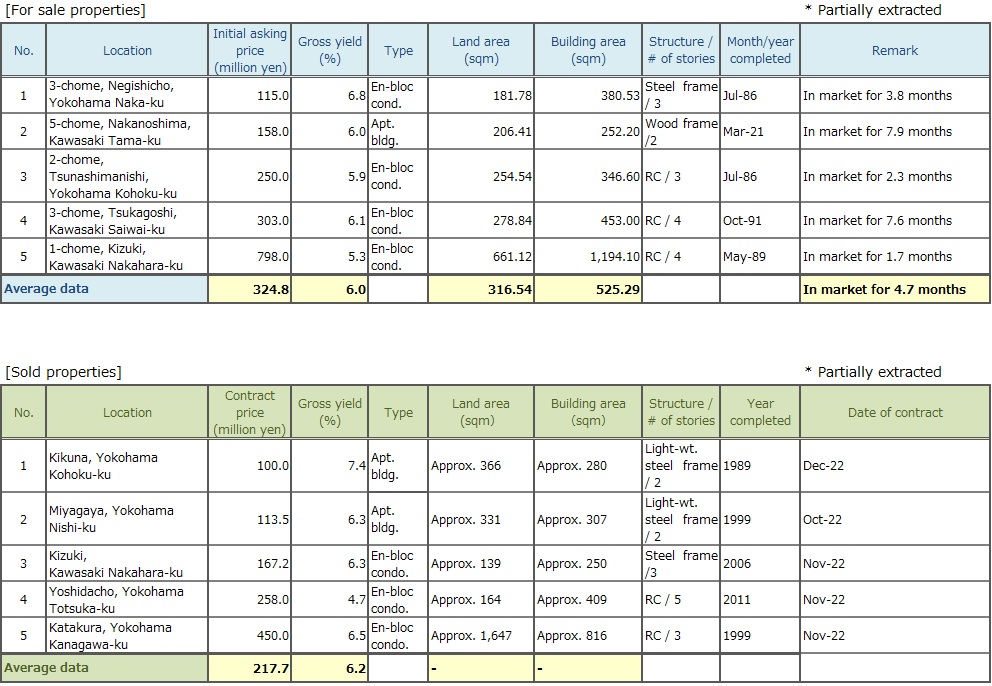
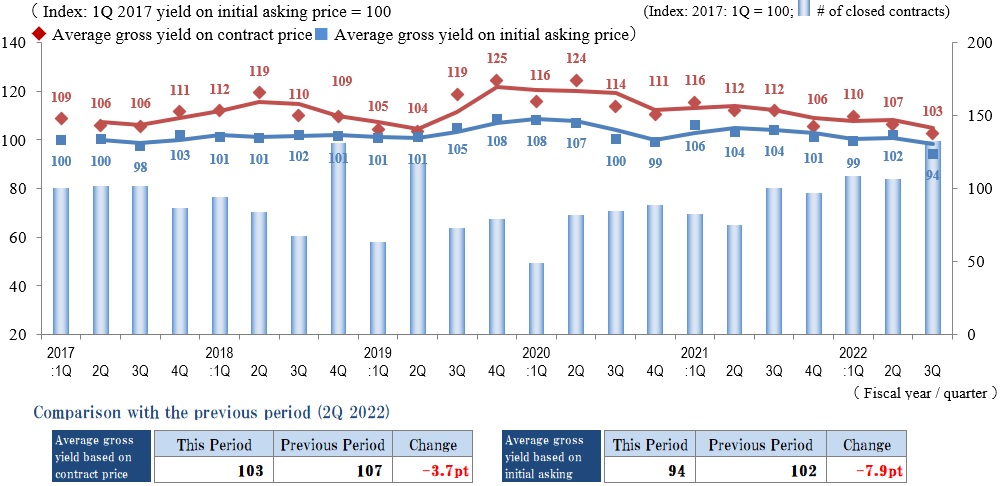
Number of Transactions here in 3Q FY2022 significantly swelled compared to not only that of 1Q and 2Q, but also a year earlier. As far as Indices of Average Gross Yield on both Contract Price and Initial Asking Price are concerned, they fell below those of the previous quarter (as prices increased). Accordingly, the market should have been still brisk.
However, what is true for average numbers may not be necessarily true for individual cases. Although there were some cases properties in central locations fetched big prices, there were an increasing number of cases where asking prices were revised downward (to push up gross yields) in order to sell quickly such properties as located in the suburban areas, far from the closest stations, or simply too old. This trend of bipolarization has become increasingly evident here.
There are so many causes for concern in the real economy such as soaring commodity and consumer prices triggered by prices of natural resources remaining high coupled with unstable exchange rates, and future movements in interest rates. There are, however, ample funds available from both domestic and offshore investors, and it seems unlikely that the market for income producing properties in this region will undergo a sudden change in the next quarter.
Nonetheless, it is prudent to closely watch future changes in monetary policy and consumer behavior, which may to some extent cause weakening of (residential) user demand in the market.
General overview
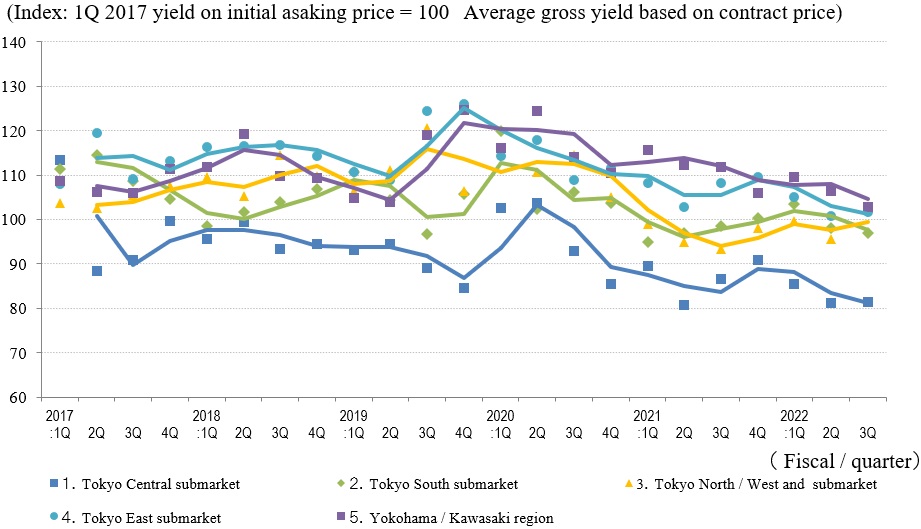
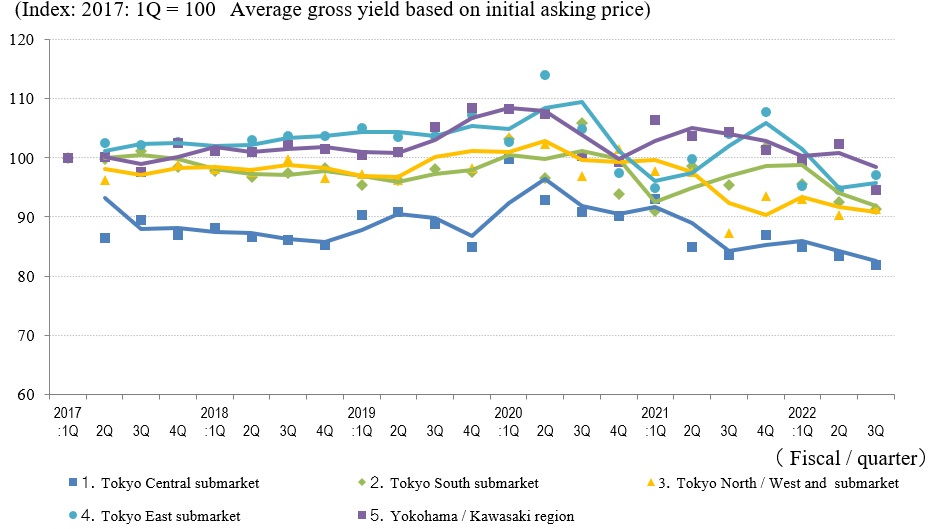
◆Movements by Quarter: Average Gross Yield on Contract Price / Average Gross Yield on Initial Asking Price / Number of Transactions for the 5 Areas
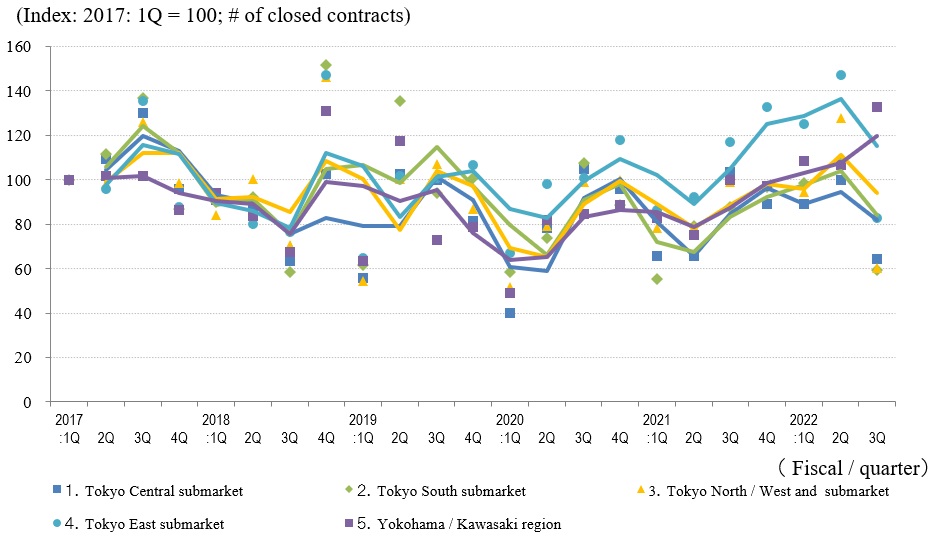
◆Movements in Number of Transactions by Area
◆Movements in Average Gross Yield on Contract Price by Area
◆Movements in Average Gross Yield on Initial Asking Price by Area
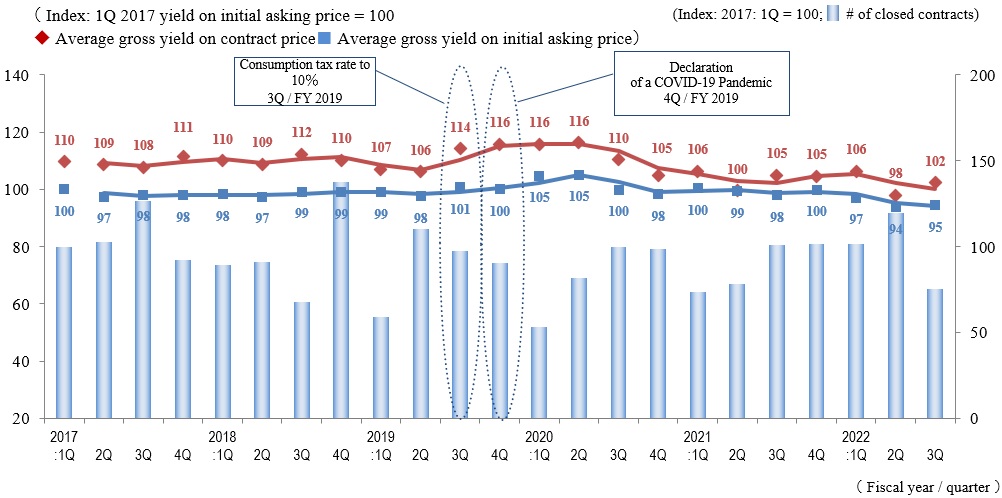
Aggregate Number of Transactions in 3Q FY2022 plummeted from the previous quarter, when it reached the highest point since 4Q FY2019, to a level close to that of 1Q FY2021. As for the submarkets and region, Number of Transactions contracted in all the submarkets of Tokyo, while it expanded in Yokohama / Kawasaki region. The decrease in the aggregate Number of Transactions is probably caused by a growing number of market participants who are concerned about a change in market cycle and taking a wait-and-see attitude rather than by diminishing number of properties put up for sale in the market.
Indices of Average Gross Yield on both Contract Price and Initial Asking Price fell (as prices rose) in Tokyo South submarket as well as Yokohama / Kawasaki region. Tokyo Central submarket must be still solid as Index of Average Gross Yield on Initial Asking Price fell by 1.5 pt. to almost match Index of Average Gross Yield on Contract Price which did not move much at 81. On the other hand, in Tokyo North / West and Tokyo East submarkets, Indices of Average Gross Yield on both Contract Price and Initial Asking Price swelled (as prices fell). Especially in Tokyo North / West submarket, a gap between Indices of Average Gross Yield on Contract Price and on Initial Asking Price has widened from 6 pt in the previous quarter to 12 pt, so it will be worthwhile to see in future surveys if this is a precursor of a turning point for the investment real estate market here which has been bullish for the last 12 months or so.
The Bank of Japan practically raised an interest rate in late December last year. Thus, it seems necessary to carefully assess how future movements in interest rate will affect the real estate market.