Our Site uses cookies to improve your experience on our website. For more details, please read our Cookie Policy.
By closing this message or starting to navigate on this website, you agree to our use of cookies.
Our Site uses cookies to improve your experience on our website. For more details, please read our Cookie Policy.
By closing this message or starting to navigate on this website, you agree to our use of cookies.


Contact
Mitsui Fudosan Realty can provide a wide range of real estate services on both investment and residential properties.
Please feel free to give us a call or contact with mail inquiry.
Phone
- China400-120-1319
- HongKong800-93-3060
- Taiwan00801-81-2728
- Japan0120-923-431
- Other Regions+81-3-6758-4072

Investment Real Estate Market Report | 4Q FY2022

Foreword
Thank you very much for your continued support and business.
We, at Mitsui Fudosan Realty, have been providing a broad range of services in order for our valued clients to make the "Best Use" of precious assets, and attentive consultation about concerns and worries clients have with respect to assets in various conditions, not only through brokerage of business and investment properties but also by helping clients to utilize assets effectively for such purposes as estate and tax planning.
As part of these efforts, we prepare an "Investment Real Estate Market Report" for reference to help clients grasp the situation affecting real estate holdings. Since the investment real estate market is susceptible to external factors such as economic trends, an objective point of view is essential to understand the current market conditions. It is our great pleasure if this report is instrumental for readers to develop asset building strategies.
We will continue striving to deliver long-term support through development, implementation, and follow-up of plans that will satisfy clients, meet demands of each client on a "one to one" basis by making the most of professional expertise and experience gained over the years, and prove worthy of clients' trust.
Please feel free to contact us at the office below with any comments or requests concerning this report, or any matters related to real estate assets.
We look forward to opportunities to serve you soon.
Mitsui Fudosan Realty Co., Ltd.
Solution Business Division
■Toll-free Number: 0120-321-376
■Hours: 9:30 am - 6:00 pm Closed Saturdays, Sundays, and holidays
■3-2-5, Kasumigaseki, Chiyoda-ku, Tokyo 100-6019, Japan
We, at Solution Business Division of Mitsui Fudosan Realty Co., Ltd., have been producing a "Investment Real Estate Market Report" to serve as an aid to hopefully assisting our valued clients formulate a medium-to long term asset building plan.
Please also take a look at our website, which is full of useful information such as properties for sale, various consultation services, and articles by real estate experts.
Areas subject to collection of data
Tokyo Central submarket: Minato-ku, Chiyoda-ku, Chuo-ku, Shibuya-ku, Shinjuku-ku, and Bunkyo-ku
Tokyo South submarket: Shinagawa-ku, Meguro-ku, Setagaya-ku, and Ota-ku
Tokyo North / West submarket: Suginami-ku, Nakano-ku, Nerima-ku, Toshima-ku, Itabashi-ku, Kita-ku, and Taito-ku
Tokyo East submarket: Koto-ku, Sumida-ku, Arakawa-ku, Edogawa-ku, Katsushika-ku, and Adachi-ku
Yokohama / Kawasaki region: Yokohama city and Kawasaki city
Detailed descriptions
Pick Up Area: For investment real estate, trends in the average gross yields on contract price and initial asking price, together with the number of closed contracts by submarkets are represented in the graph. The details of the transition of actual market value and properties both for sale and sold in certain neighborhoods are also shown.
Market Overview: As an overview of all the submarkets, the trend from the past to this quarter is available. Trends in the average gross yields based on contract price and initial asking price together with the number of closed contracts by area are shown for comparison.
Data Source: Information is extracted from the database containing properties offered for sale and contracts concluded through Mitsui Fudosan Realty Network (En-bloc condominiums / office buildings / apartment buildings).
- Number of Transactions & Average Gross Yield on Contract Price: Number of contracts closed in a quarter (three months) and average gross yield of them (including estimated values)
- Average Gross Yield on Initial Asking Price: Quarterly average gross yield of closed contracts based on their asking price initially quoted
*Figures in each chart represent indices based on values for 1Q / FY2017 set at 100.
(Average Gross Yield on Contract Price is shown as an index to Average Gross Yield on Initial Asking Price for 1Q / FY 2017 set at 100.)
[Note] The historical data may be revised subsequently due to maintenance carried out from time to time, such as adding newly acquired data.
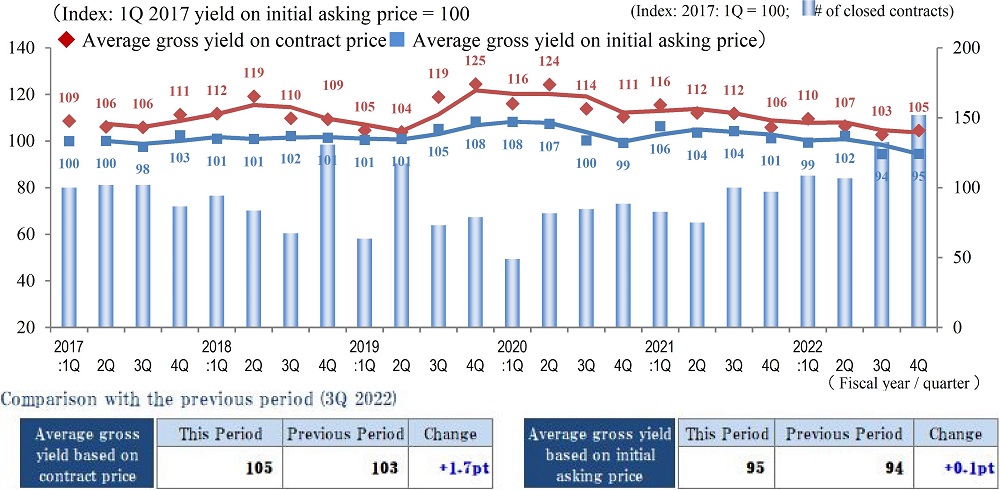
Pick Up Area -Tokyo Central submarket-
(*)Tokyo Central submarket: Minato-ku, Chiyoda-ku, Chuo-ku, Shibuya-ku, Shinjuku-ku, and Bunkyo-ku
◆Movements by Quarter: Average Gross Yield on Contract Price / Average Gross Yield on Initial Asking Price / Number of Transactions
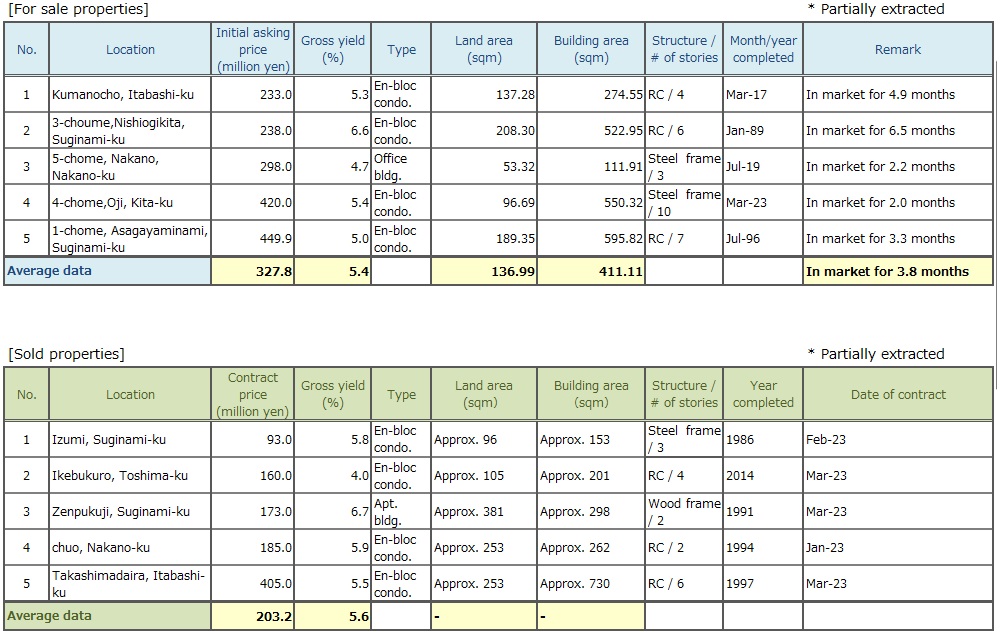
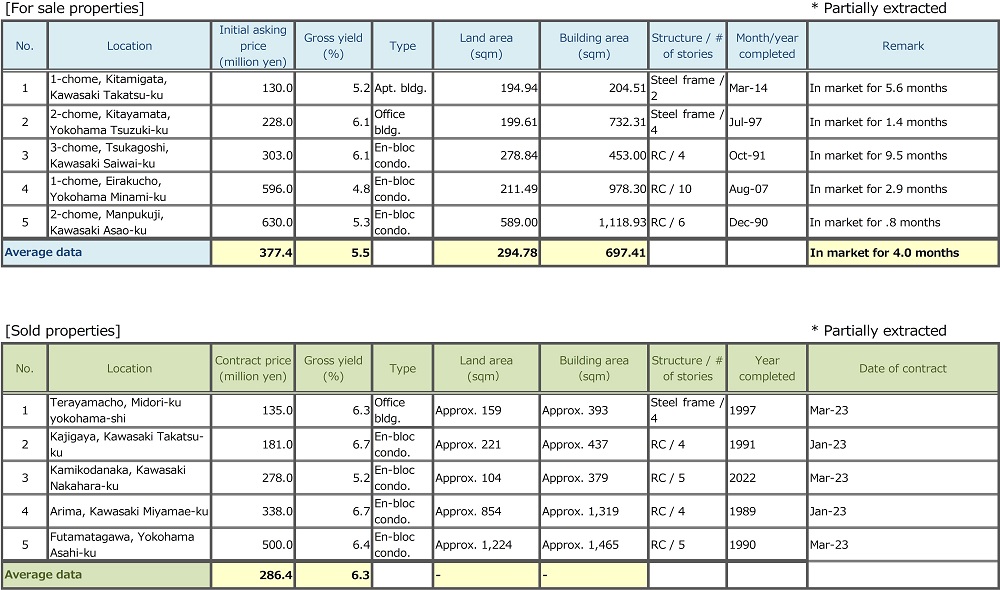
◆Brokered Transactions of Investment Real Estate in the Submarket
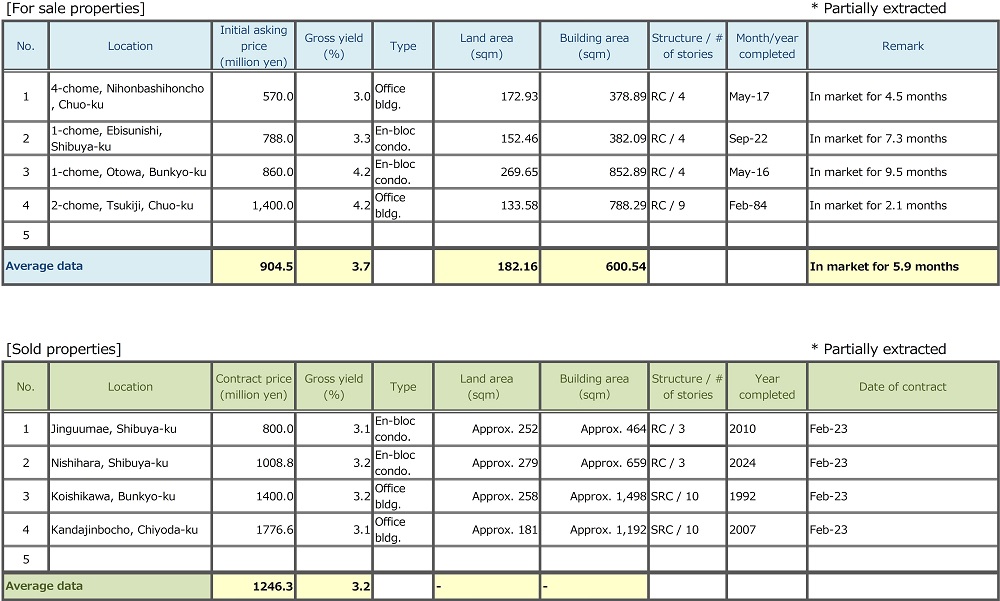
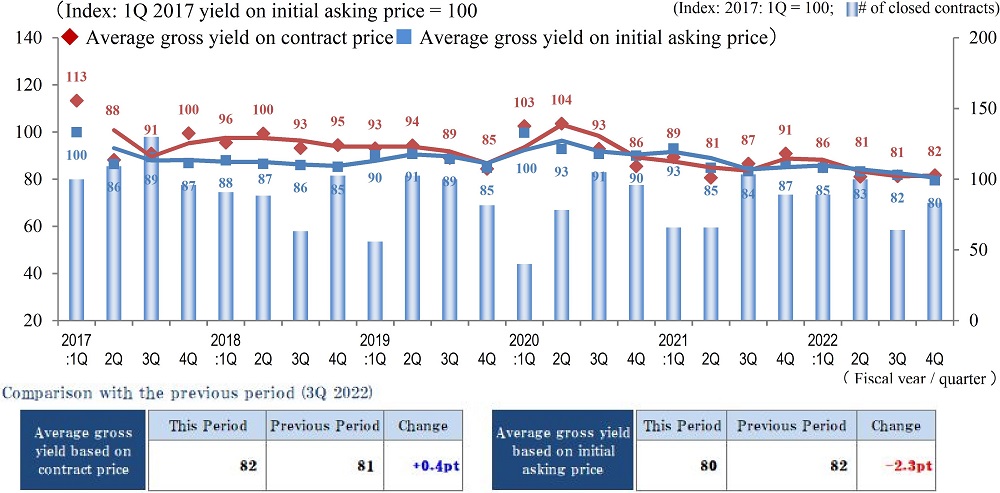
Index of Average Gross Yield on Contract Price for Tokyo Central submarket moved little for three quarters in a row and ended at 82 (up 0.4 pt QoQ) in 4Q / FY2022.
At the same time, Index of Average Gross Yield on Initial Asking Price fell 2.3 pt QoQ (prices rose) to 80 in the same quarter.Both yields have been consistently kept low (or prices have been kept high) since 1Q / FY2017, evidencing a bull market lasting for a long time.
Number of Transactions, however, was not as sizeable as the same quarter in other years. Investors probably took a cautious attitude due to uncertainty about a future level of interest rates after BoJ's de facto rate hike in the previous quarter and because of speculation about a revision in monetary policy by BoJ's new governor.
Although there are uncertainties as to real economy such as a future trend in interest rates and a rise in both corporate and consumer prices due to depreciation of the Japanese Yen and continuing high prices of natural resources, the investment real estate is believed to remain as it is now.While the level of yields from an investor's point of view is about to reach the limits, it is necessary to keep a close eye on movements in rents to see if the current market conditions can be maintained in the future.
Pick Up Area -Tokyo South submarket-
(*) Tokyo South submarket: Shinagawa-ku, Meguro-ku, Setagaya-ku, and Ota-ku
◆Movements by Quarter: Average Gross Yield on Contract Price / Average Gross Yield on Initial Asking Price / Number of Transactions
◆Brokered Transactions of Investment Real Estate in the Submarket
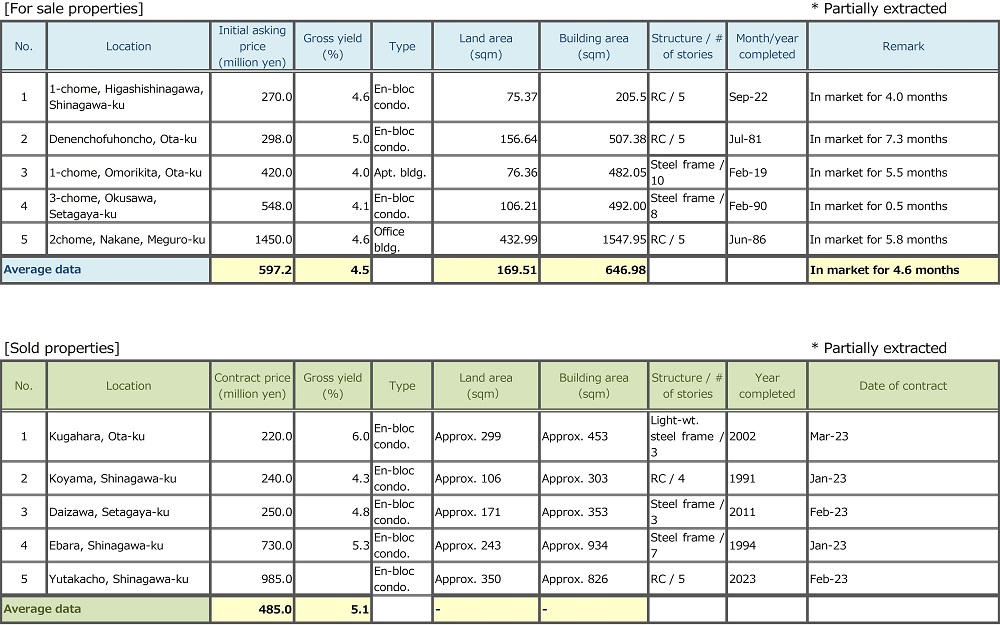
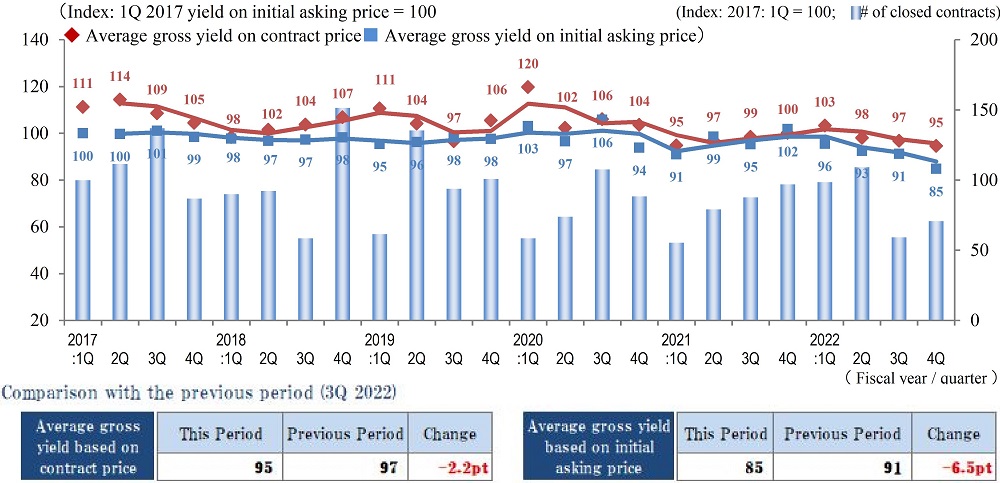
Index of Average Gross Yield on Contract Price here in 4Q / FY2022 slid again by 2.2 pt QoQ. This was the third quarterly decline in a row (as prices rose).
Moreover, Index of Average Gross Yield on Initial Asking Price fell sharply by 6.5 pt QoQ to 85. This was the fourth quarterly decrease in a row (as prices increased).As a result, both Indices of Average Gross Yield on Contract Price and on Initial Asking Price reached their lowest points since 1Q / FY 2017.It is interesting to note that spreads between the two indices have been widening, whiel they have been on a downward trend.
On the other hand, Number of Transactions contracted YoY for two consecutive quarters.The contraction may be attributed to widening gap between yield on seller's asking price and buyer's expected return as an overall price level moves up making it harder for a seller and buyer to come to terms on pricing.
Movements in yields and a number of transactions need to be monitored further in order to grasp the situation of investment real estate market.
Pick Up Area -Tokyo North / West submarket-
(*) Tokyo North / West submarket: Suginami-ku, Nakano-ku, Nerima-ku, Toshima-ku, Itabashi-ku, Kita-ku, and Taito-ku
◆Movements by Quarter: Average Gross Yield on Contract Price / Average Gross Yield on Initial Asking Price / Number of Transactions
◆Brokered Transactions of Investment Real Estate in the Submarket
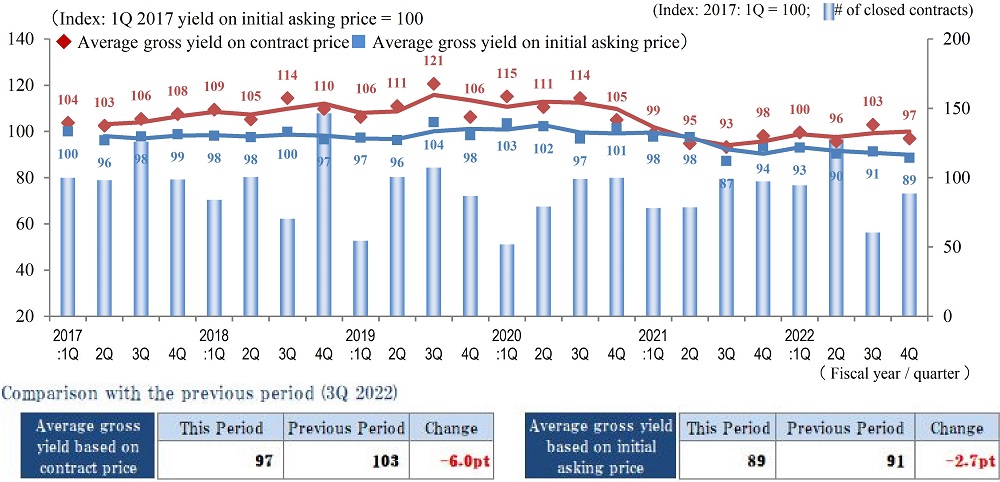
As average contract price went up, the Index of Average Gross Yield on Contract Price fell by 6.0 pt QoQ to 97 in 4Q / FY 2022 here.Index of Average Gross Yield on Initial Asking Price also declined by 2.7 pt QoQ to 89, as average asking price rose.Number of Transactions, which had shrunk in the previous quarter, took an upward turn to almost match that of 1Q / FY2022.
Number of Transactions increased this quarter probably because the submarket attracted potential investors' attention after yields on both contract and initial asking prices rose (or prices fell) in the previous quarter making properties here seem to be a bargain compared to those in Tokyo Central and Tokyo South submarkets.
While there are encouraging news starting this year such as post-covid recovery of service-related consumption and spending by inbound tourists, and pay-scale increase by major companies, there are causes for concern carried over from the last fiscal year such as soaring commodity and consumer prices, unstable exchange rates, and revision of a monetary policy home and abroad. It will be essential to still keep an eye on changes in economic environment.
Pick Up Area -Tokyo East submarket-
(*) Tokyo East submarket: Koto-ku, Sumida-ku, Arakawa-ku, Edogawa-Ku, Katsushika-ku, and Adachi-ku
◆Movements by Quarter: Average Gross Yield on Contract Price / Average Gross Yield on Initial Asking Price / Number of Transactions
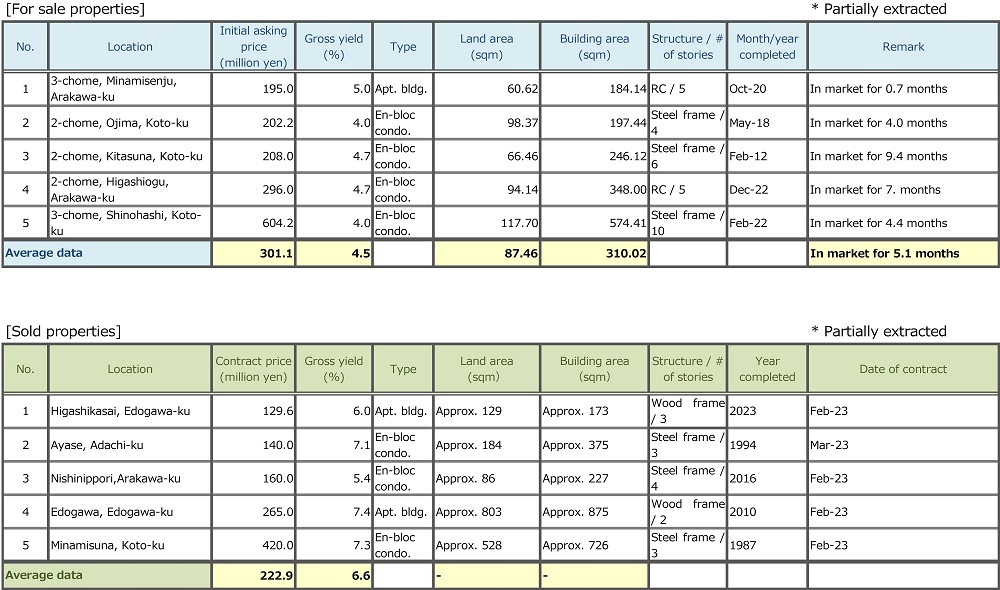
◆Brokered Transactions of Investment Real Estate in the Submarket
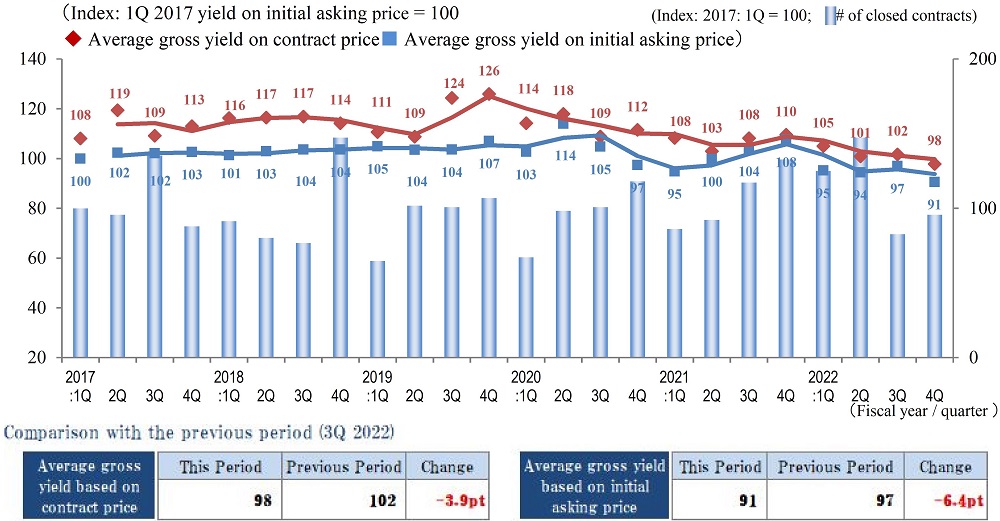
Indices of Average Gross Yield on Contract Price and Initial Asking Price 4Q / FY2022 here were 98 (down by 3.9 pt QoQ, prices rose) and 91 (down by 6.4 pt QoQ, prices rose), respectively.Both indices cut the previous record lows of 2Q / FY2022 since 1Q / FY2017.On the other hand, Number of Transactions was fewer than that of a year earlier.
Inbound demand from overseas investors is gradually spilling over to this submarket from the city center, and overall the investment real estate market here seems still bullidh without a hitch.As demand continues to exceed supply, property prices keep going up here.However, yields on properties old and obsolete or located far from stations are creeping up, and a gap between those and properties lately-built and located near from stations is widening. Target properties will be further bipolarized from now on.
There are a number of grounds for concern such as prolongation of conflict in Ukraine, interest rate hikes in the US, and rising prices of commodity and energy in Japan. A change of tide, whether property values go down because of them or stay unchanged in spite of them, may be coming soon.It must be appropriate to closely watch how the currently brisk property market here will turn from now on.
Pick Up Area -Yokohama / Kawasaki region-
(*) Yokohama and Kawasaki region: Yokohama city, Kawasaki city
◆Movements by Quarter: Average Gross Yield on Contract Price / Average Gross Yield on Initial Asking Price / Number of Transactions
◆Brokered Transactions of Investment Real Estate in the Submarket
Number of Transactions here in 4Q / FY2022 increased significantly on both QoQ and YoY base.It was the record high since the start of data collection (in FY2017). On the other hand, Indices of Average Gross Yield on both Contract Price and Initial Asking Price moved little.Although the market here continues to thrive, prices seems to have reached a plateau.
By looking carefully at individual transactions, there were many cases of large disparity found between properties centrally located in the commercialized sections and properties located in the suburban area or far from stations in terms of pricing and the time duration required until contracts. This tendency to bipolarization has become increasingly evident here.
Since there are many causes for concern about both real economy and real estate market such as soaring construction cost and consumer prices, and unstable exchange rates on top of a suggestion of higher interest rates, some investors are found to take cautious steps while there are ample funds still available from both domestic and offshore investors.
Although it is not highly likely that the real estate market here will fluctuate wildly, it will be prudent to keep a close eye on it because there is still a possibility that it may soften slightly depending on future changes in monetary policy and investors' reaction to them.
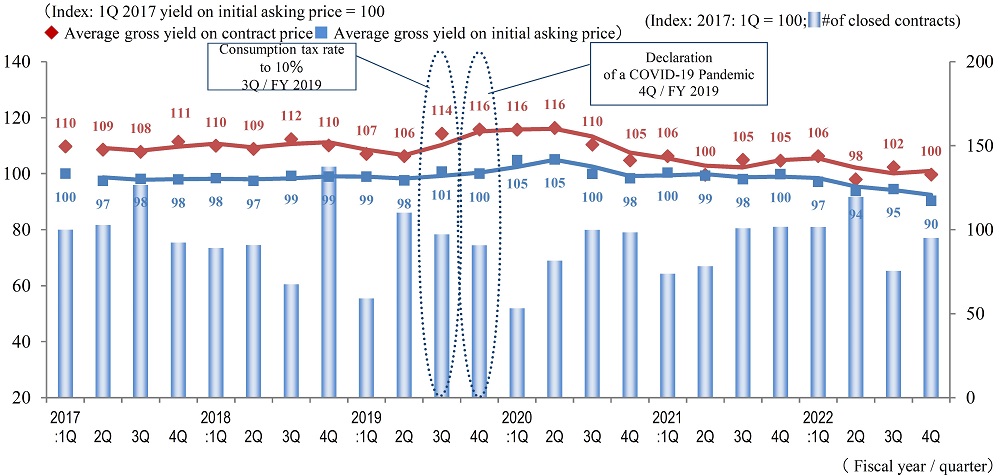
General overview
◆Movements by Quarter: Average Gross Yield on Contract Price / Average Gross Yield on Initial Asking Price / Number of Transactions for the 5 Areas
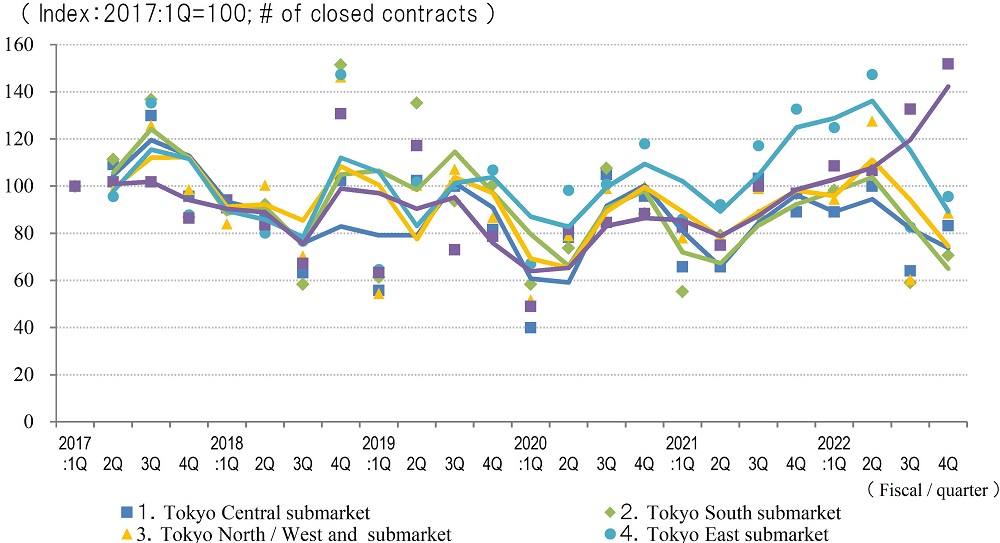
◆Movements in Number of Transactions by Area
◆Movements in Average Gross Yield on Contract Price by Area

◆Movements in Average Gross Yield on Initial Asking Price by Area
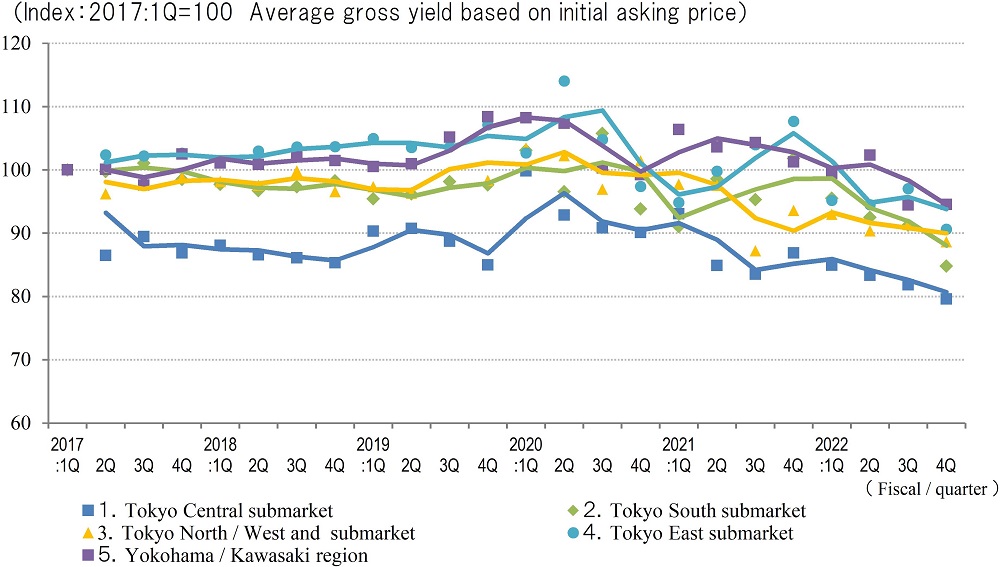
In 4Q / FY2022, Indices of Average Gross Yield on both Contract Price and Initial Asking Price fell QoQ in all submarkets of Tokyo except for Tokyo Central submarket where Index of Average Gross Yield on Contract Price stayed almost unchanged and Index of Average Gross Yield on Initial Asking Price declined.As for Tokyo North / West submarket, a wide disparity as much as 12 pt was pointed out in the previous report between Indices of Average Gross Yield on Contract Price and Initial Asking Price. Now the gap narrowed to 8 pt this quarter.Overall, investment real estate market in Tokyo can be regarded as robust as yields are maintained at low levels.As for Yokohama & Kawasaki region, Index of Average Gross Yield on Contract Price moved up a little while Index of Average Gross Yield on Initial Asking Price stayed almost unchanged. The market here seem to be firm and steady.Number of Transactions this quarter exceeded last quarter's number in all the submarkets of Tokyo and Yokohama & Kawasaki region.
However, Number of Transactions renders a different picture of the investment real estate market than Average Gross Yields, as the transaction volume has shrunk YoY in four submarkets of Tokyo.It must be soaring property prices that have led to dwindling Number of Transactions.On the other hand, Number of Transactions in Yokohama & Kawasaki region swelled by approximately 15% YoY to reach a record high since 1Q / FY2017.
While there are encouraging news such as post-covid recovery of consumption and demand by inbound tourists, there are uncertainties over future economic conditions such as soaring commodity prices at home, and bank failures in the U.S. It will be imperative to cautiously probe consequences of such economic conditions for the real estate market.