Our Site uses cookies to improve your experience on our website. For more details, please read our Cookie Policy.
By closing this message or starting to navigate on this website, you agree to our use of cookies.
Our Site uses cookies to improve your experience on our website. For more details, please read our Cookie Policy.
By closing this message or starting to navigate on this website, you agree to our use of cookies.


Contact
Mitsui Fudosan Realty can provide a wide range of real estate services on both investment and residential properties.
Please feel free to give us a call or contact with mail inquiry.
Phone
- China400-120-1319
- HongKong800-93-3060
- Taiwan00801-81-2728
- Japan0120-923-431
- Other Regions+81-3-6758-4072

Investment Real Estate Market Report | 1Q FY2023

Foreword
Thank you very much for your continued support and business.
We, at Mitsui Fudosan Realty, have been providing a broad range of services in order for our valued clients to make the "Best Use" of precious assets, and attentive consultation about concerns and worries clients have with respect to assets in various conditions, not only through brokerage of business and investment properties but also by helping clients to utilize assets effectively for such purposes as estate and tax planning.
As part of these efforts, we prepare an "Investment Real Estate Market Report" for reference to help clients grasp the situation affecting real estate holdings. Since the investment real estate market is susceptible to external factors such as economic trends, an objective point of view is essential to understand the current market conditions. It is our great pleasure if this report is instrumental for readers to develop asset building strategies.
We will continue striving to deliver long-term support through development, implementation, and follow-up of plans that will satisfy clients, meet demands of each client on a "one to one" basis by making the most of professional expertise and experience gained over the years, and prove worthy of clients' trust.
Please feel free to contact us at the office below with any comments or requests concerning this report, or any matters related to real estate assets.
We look forward to opportunities to serve you soon.
Mitsui Fudosan Realty Co., Ltd.
Solution Business Division
■Toll-free Number: 0120-321-376
■Hours: 9:30 am - 6:00 pm Closed Saturdays, Sundays, and holidays
■3-2-5, Kasumigaseki, Chiyoda-ku, Tokyo 100-6019, Japan
We, at Solution Business Division of Mitsui Fudosan Realty Co., Ltd., have been producing a "Investment Real Estate Market Report" to serve as an aid to hopefully assisting our valued clients formulate a medium-to long term asset building plan.
Please also take a look at our website, which is full of useful information such as properties for sale, various consultation services, and articles by real estate experts.
Areas subject to collection of data
Tokyo Central submarket: Minato-ku, Chiyoda-ku, Chuo-ku, Shibuya-ku, Shinjuku-ku, and Bunkyo-ku
Tokyo South submarket: Shinagawa-ku, Meguro-ku, Setagaya-ku, and Ota-ku
Tokyo North / West submarket: Suginami-ku, Nakano-ku, Nerima-ku, Toshima-ku, Itabashi-ku, Kita-ku, and Taito-ku
Tokyo East submarket: Koto-ku, Sumida-ku, Arakawa-ku, Edogawa-ku, Katsushika-ku, and Adachi-ku
Yokohama / Kawasaki region: Yokohama city and Kawasaki city
Detailed descriptions
Pick Up Area: For investment real estate, trends in the average gross yields on contract price and initial asking price, together with the number of closed contracts by submarkets are represented in the graph. The details of the transition of actual market value and properties both for sale and sold in certain neighborhoods are also shown.
Market Overview: As an overview of all the submarkets, the trend from the past to this quarter is available. Trends in the average gross yields based on contract price and initial asking price together with the number of closed contracts by area are shown for comparison.
Data Source: Information is extracted from the database containing properties offered for sale and contracts concluded through Mitsui Fudosan Realty Network (En-bloc condominiums / office buildings / apartment buildings).
- Number of Transactions & Average Gross Yield on Contract Price: Number of contracts closed in a quarter (three months) and average gross yield of them (including estimated values)
- Average Gross Yield on Initial Asking Price: Quarterly average gross yield of closed contracts based on their asking price initially quoted
*Figures in each chart represent indices based on values for 1Q / FY2017 set at 100.
(Average Gross Yield on Contract Price is shown as an index to Average Gross Yield on Initial Asking Price for 1Q / FY 2017 set at 100.)
[Note] The historical data may be revised subsequently due to maintenance carried out from time to time, such as adding newly acquired data.
Pick Up Area -Tokyo Central submarket-
(*)Tokyo Central submarket: Minato-ku, Chiyoda-ku, Chuo-ku, Shibuya-ku, Shinjuku-ku, and Bunkyo-ku
◆Movements by Quarter: Average Gross Yield on Contract Price / Average Gross Yield on Initial Asking Price / Number of Transactions
◆Brokered Transactions of Investment Real Estate in the Submarket
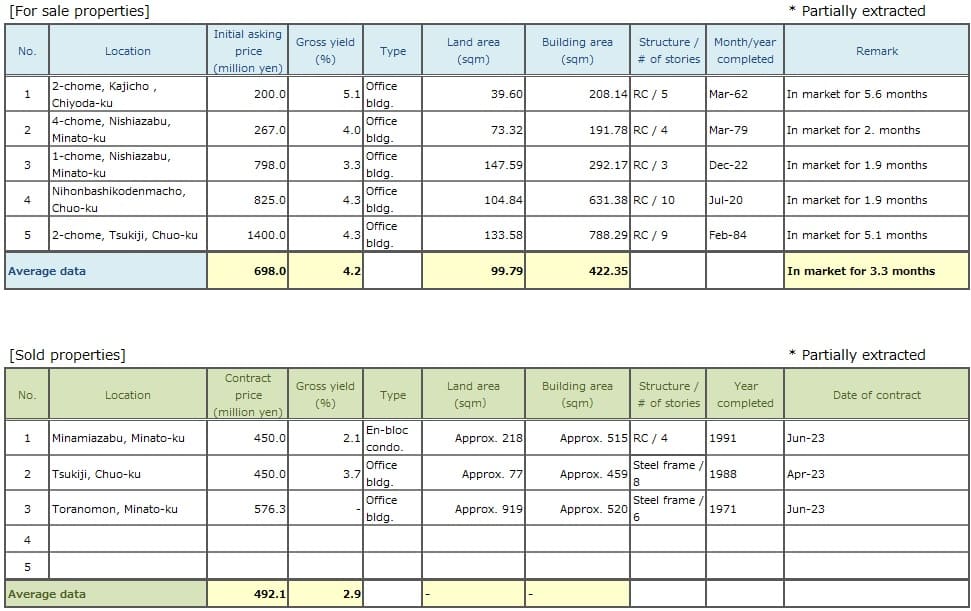
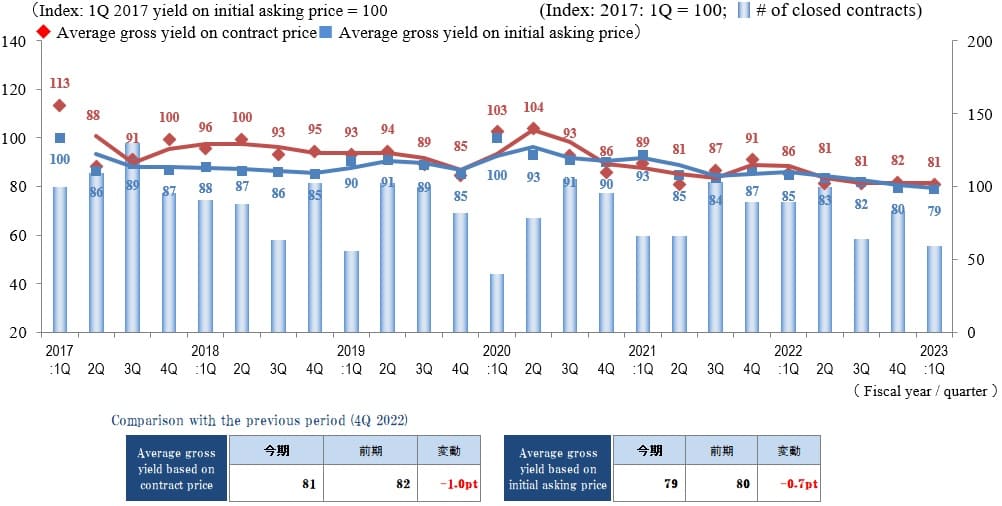
The Index of the Average Gross Yield on the Contract Price for the Tokyo central submarket moved little for four quarters in a row and ended at 81 (down by 1.0 pt QoQ) in 1Q / FY 2023.
At the same time, the Index of the Average Gross Yield on the Initial Asking Price fell 0.7 pt QoQ (prices rose) to 79 in the same quarter. Although yields increased during the COVID-19 pandemic in FY 2020, both yields have consistently been kept low (or prices have been kept high) since 1Q / FY 2017, evidencing a bull market lasting for a long time.
At the same time, the number of transactions reached its lowest point in any quarter since 1Q / FY 2017 other than 1Q / FY 2020, which was impacted strongly by the COVID-19 pandemic.
The contraction may be attributed to a widening gap between the yield on the seller's asking price and the buyer's expected return as the overall price level moves up, making it harder for a seller and buyer to come to terms on pricing.
Although there are some causes for concern about both the real economy and the real estate market, such as soaring construction costs and consumer prices on top of the suggestion for higher interest rates, the appetite for investment remains strong among both domestic and offshore investors. As consultations on selling properties show an increasing trend among investors who see the current market as a seller's market, it will be prudent to keep a close eye on how movements among domestic and overseas investors will impact the market in the future.
Pick Up Area -Tokyo South submarket-
(*) Tokyo South submarket: Shinagawa-ku, Meguro-ku, Setagaya-ku, and Ota-ku
◆Movements by Quarter: Average Gross Yield on Contract Price / Average Gross Yield on Initial Asking Price / Number of Transactions
◆Brokered Transactions of Investment Real Estate in the Submarket
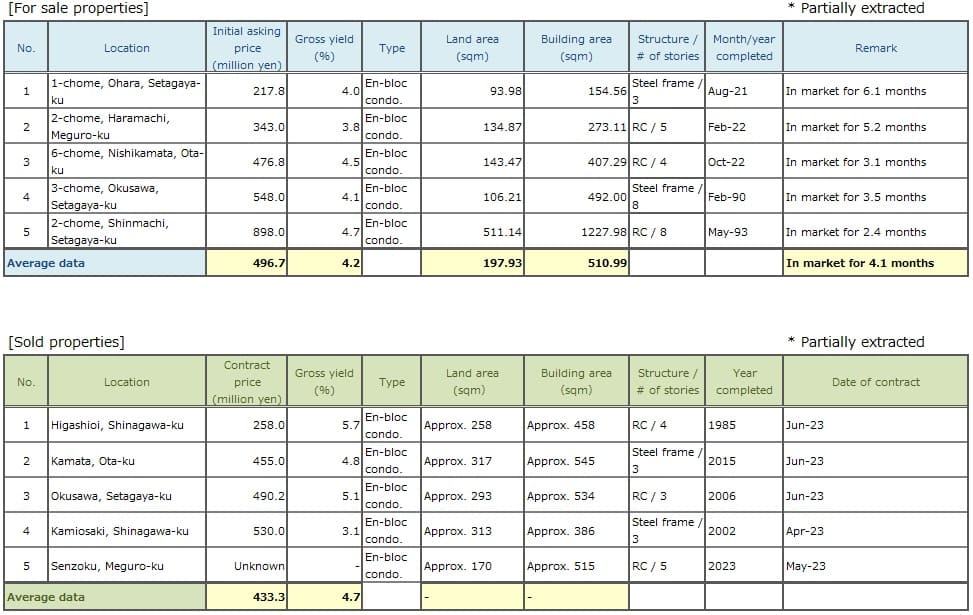
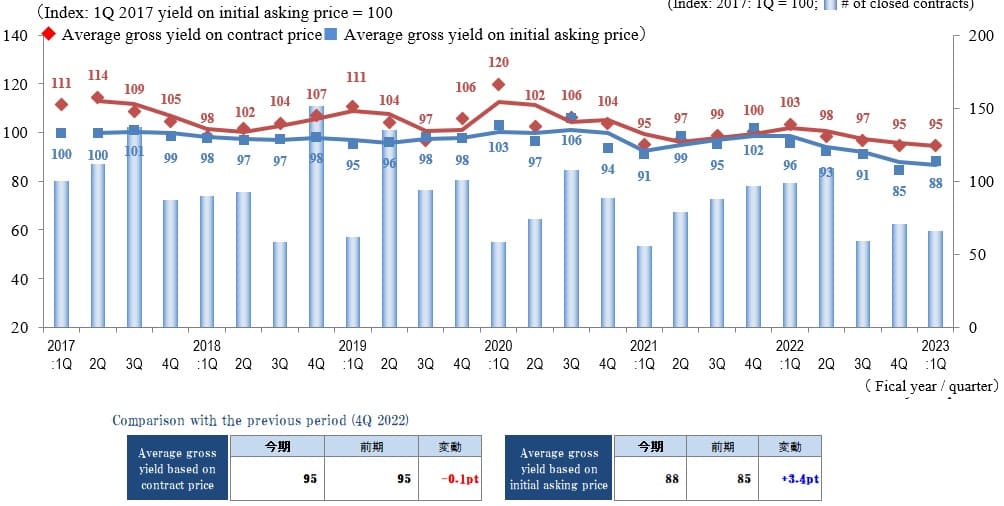
The Index of the Average Gross Yield on the Contract Price here in 1Q / FY 2023 remained unchanged QoQ at 95. This was its lowest level since 1Q / FY 2017. The Index of the Average Gross Yield on the Initial Asking Price rebounded to rise by 3.4 pt QoQ (prices fell) to 88 in the same quarter, after falling for four consecutive quarters until the last quarter.
While the Index of the Average Gross Yield on the Initial Asking Price increased somewhat and since both Indices of the Average Gross Yield on the Contract Price and on the Initial Asking Price are at low levels, favorable conditions would appear to be continuing this fiscal year.
On the other hand, the number of transactions contracted YoY for three consecutive quarters as yields remained low. Since the gap is growing between the Indices of the Average Gross Yield on the Contract Price and on the Initial Asking Price, a price gap has appeared between sellers and buyers. Rising prices and a decrease in the number of attractive properties on the market may be leading to a slowdown in the number of transactions. Movements in yields and the number of transactions need to be monitored further in order to grasp the situation in the investment real estate market.
Pick Up Area -Tokyo North / West submarket-
(*) Tokyo North / West submarket: Suginami-ku, Nakano-ku, Nerima-ku, Toshima-ku, Itabashi-ku, Kita-ku, and Taito-ku
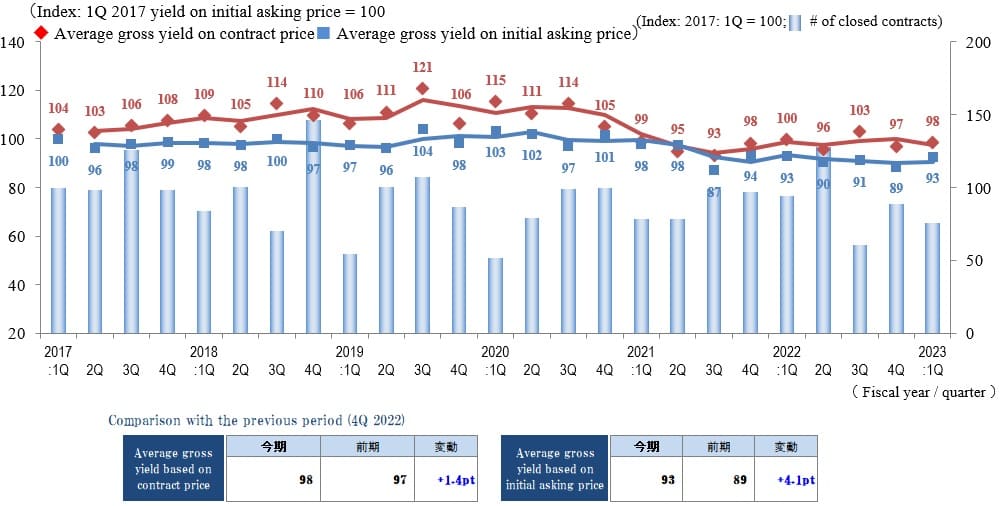
◆Movements by Quarter: Average Gross Yield on Contract Price / Average Gross Yield on Initial Asking Price / Number of Transactions
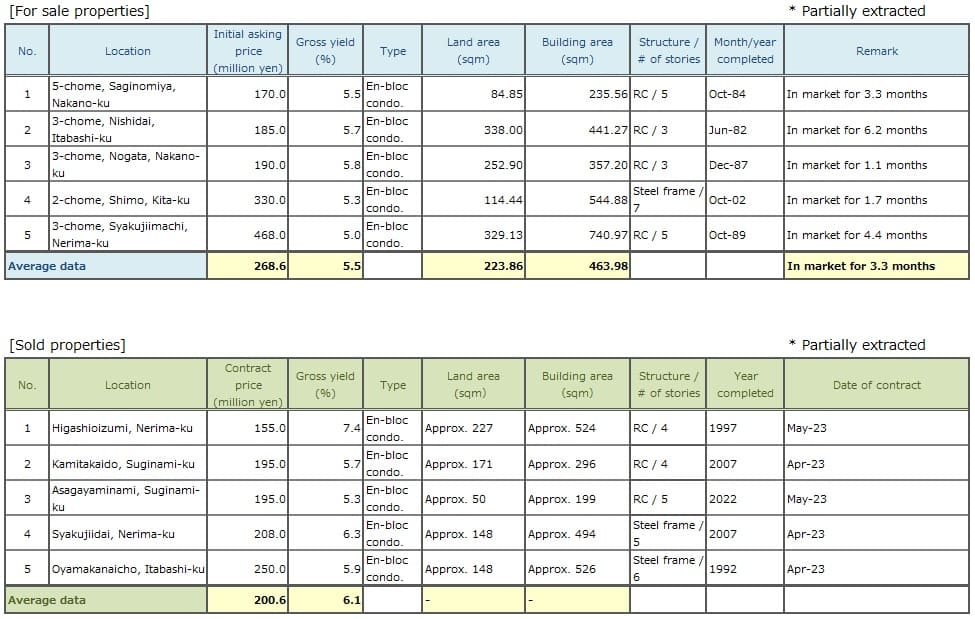
◆Brokered Transactions of Investment Real Estate in the Submarket
As the average contract price fell, the Index of the Average Gross Yield on the Contract Price rose by 1.4 pt QoQ to 98 in 1Q / FY 2023 here. The Index of the Average Gross Yield on the Initial Asking Price also increased by 4.1 pt QoQ to 93 as the average asking price fell. The strength of market conditions started to weaken in this submarket as the number of transactions, which had risen the last quarter, fell this quarter.
One conceivable main cause of the decrease in the number of transactions this quarter is the fact that buyers showed a cautious attitude while sellers were bullish as yields fell (prices rose) on both the contract price and the asking price.
While buying demand remains strong in this submarket, there is a tendency toward bipolarization as buyers' responses are centered on properties in favorable locations, such as those near stations while some properties in less favorable locations, such as those distant from stations, have remained stagnant over lengthy periods.
Despite rising expectations for a recovery in inbound tourism demand backed by rising numbers of visitors from abroad centered on central Tokyo and depreciation of the Japanese yen, the outlook appears uncertain in light of such factors as inflation and international developments (i.e., the situation Ukrainian situation, US and European monetary policy, and China's economic recovery). Therefore, it is necessary to keep a close eye on how these factors may impact the domestic real estate market in the future.
Pick Up Area -Tokyo East submarket-
(*) Tokyo East submarket: Koto-ku, Sumida-ku, Arakawa-ku, Edogawa-Ku, Katsushika-ku, and Adachi-ku
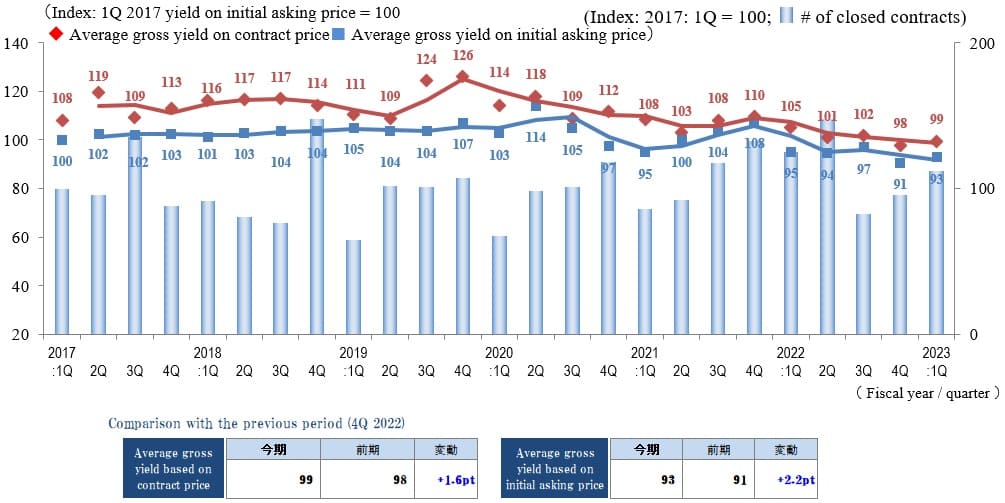
◆Movements by Quarter: Average Gross Yield on Contract Price / Average Gross Yield on Initial Asking Price / Number of Transactions
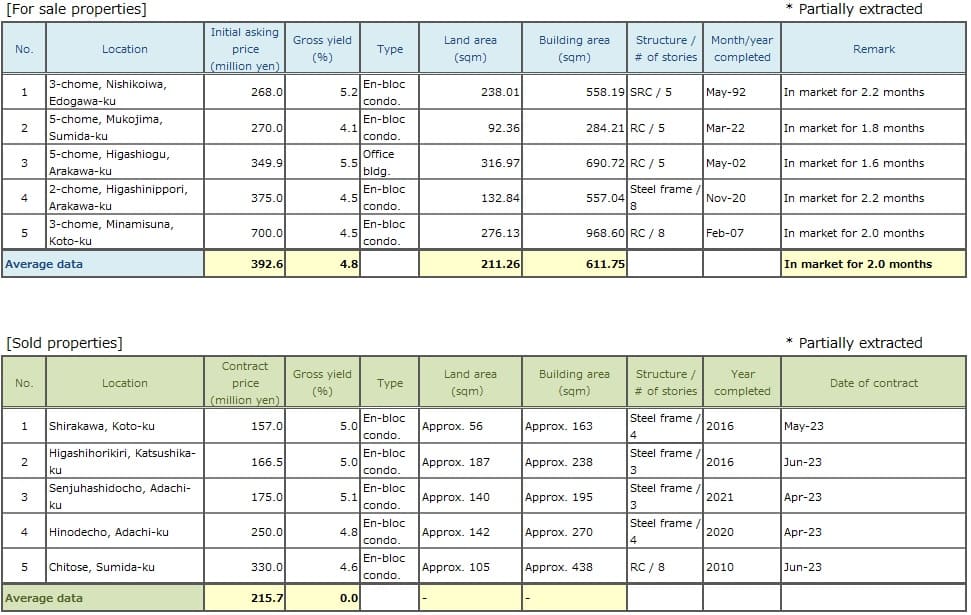
◆Brokered Transactions of Investment Real Estate in the Submarket
The Indices of the Average Gross Yield on the Contract Price and the Initial Asking Price 1Q / FY 2023 here were 99 (up 2.2 pt QoQ, prices fell) and 93 (up 2.2 pt QoQ, prices fell), respectively. Although both indices rose slightly from the previous record lows of 4Q / FY2022 since 1Q / FY2017, their levels remain low.
While the number of transactions usually decreases in 1Q, as the start of the fiscal year, it reached the highest record in this quarter even when compared to 1Q results since FY 2017, as the number of transactions grew QoQ due to this submarket's relatively higher yields compared to the Tokyo central and Tokyo south submarkets and a continued environment in which it is fairly easy to reach agreement between seller and buyer on prices due to a favorable demand-supply balance.
In the absence of any major changes in domestically or international social conditions or monetary policies, the real-estate investment market in this submarket can be expected to remain stable for the time being. However, some investors already appear to be taking a cautious approach. We will strive to ascertain conditions in a timely manner by checking real estate-related indicators and ascertaining investor sentiment.
Pick Up Area -Yokohama / Kawasaki region-
(*) Yokohama and Kawasaki region: Yokohama city, Kawasaki city
◆Movements by Quarter: Average Gross Yield on Contract Price / Average Gross Yield on Initial Asking Price / Number of Transactions
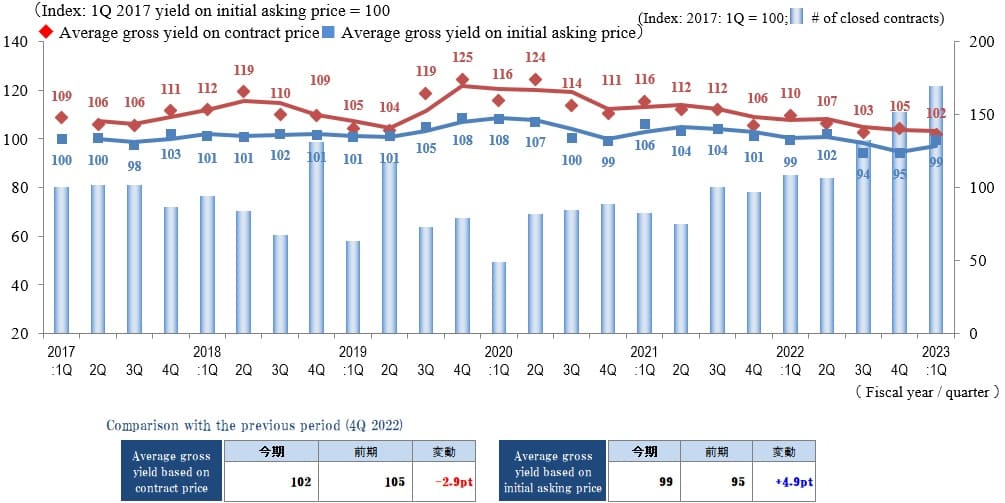
◆Brokered Transactions of Investment Real Estate in the Submarket
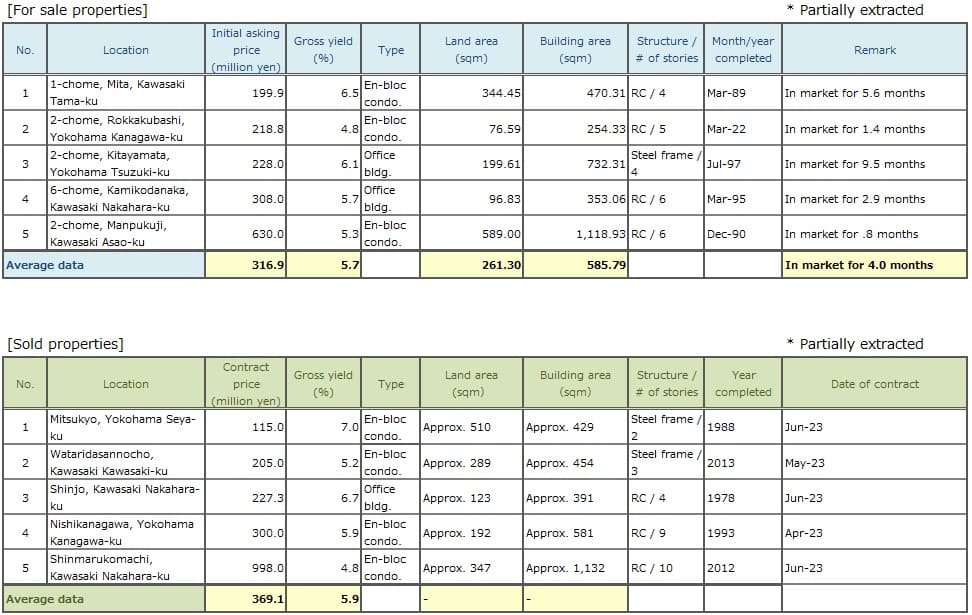
The number of transactions here in 1Q / FY2023 increased significantly on both the QoQ and YoY base. This was a record high since the start of data collection (in FY2017), and the slight downward trend in the Average Gross Yield on the Contract Price continued. Ample funds are still available from investors, and the trend in prices of revenue-generating real estate probably could be described as bullish overall.
Looking at transaction details, there were many cases of large disparities found between properties centrally located in the commercialized sections and properties located in the suburban area or far from stations in terms of pricing and the length of the time duration required until contracts. This tendency to bipolarization has become increasingly evident here.
Furthermore, looking at environmental conditions, in some cases, the percentage of the acquisition cost for a land is reduced, as construction costs continue to rise due to the skyrocketing prices of materials, energy, and labor. As a result, there is possibility that land prices may fall temporarily, except in some prime locations.
Although it is not highly probable that the real estate market here will fluctuate wildly in 2Q, it will be prudent to keep a close eye on it because there is still a possibility that it may soften slightly depending on future changes in monetary policy and investors' reaction to them.
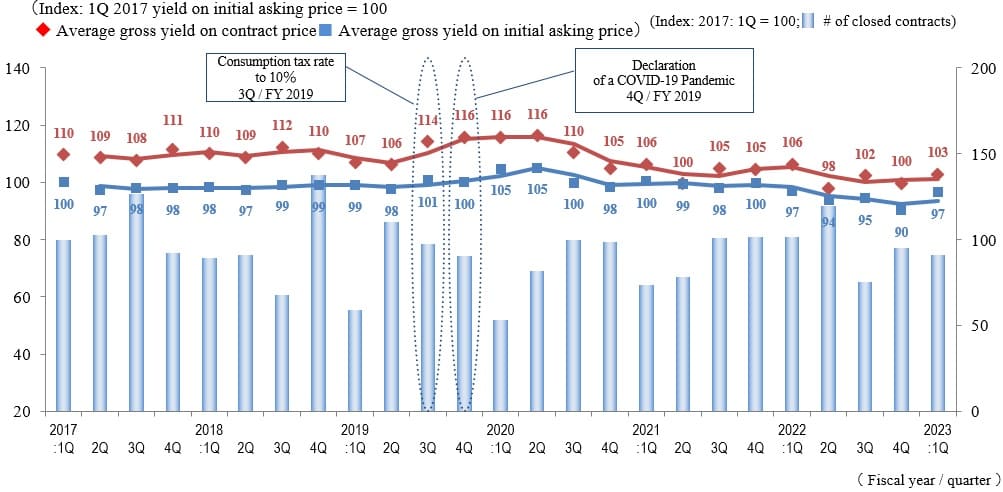
General overview
◆Movements by Quarter: Average Gross Yield on Contract Price / Average Gross Yield on Initial Asking Price / Number of Transactions for the 5 Areas
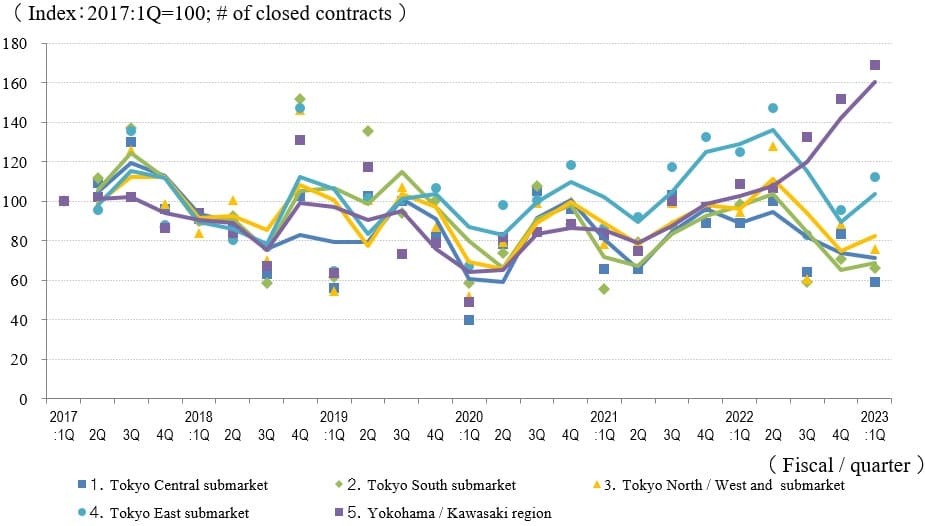
◆Movements in Number of Transactions by Area
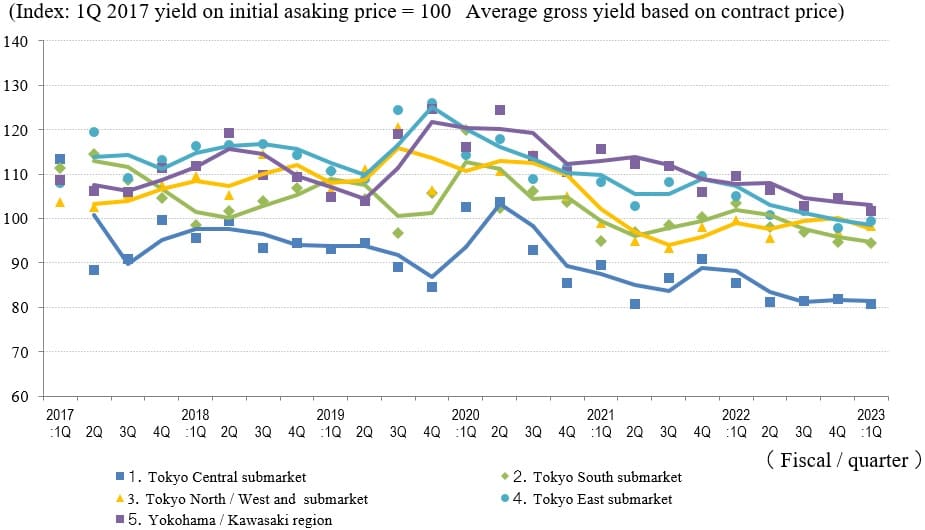
◆Movements in Average Gross Yield on Contract Price by Area
◆Movements in Average Gross Yield on Initial Asking Price by Area
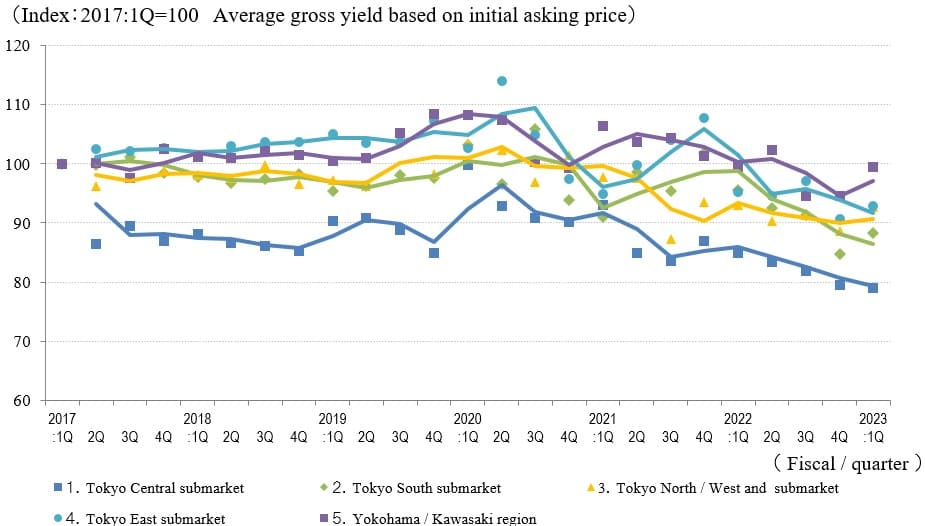
In 1Q / FY 2023, the Indices of the Average Gross Yield on the Contract Price stayed almost unchanged QoQ in the Tokyo Central and Tokyo South submarkets, rose in the Tokyo North / West and Tokyo East submarket, and fell in the Yokohama / Kawasaki region. The Index of the Average Gross Yield on the Initial Asking Price fell (prices rose) in the Tokyo Central submarket but rose somewhat (the Initial Asking Price fell) in the other four submarket. Overall, investment real estate market in Tokyo can be regarded as robust as yields are maintained at low levels.
As it had last quarter, the number of transactions continued to fall in all four Tokyo submarkets YoY. While it increased in the Tokyo east submarket QoQ, it fell in the other three submarkets.
The number of transactions reached a new record high since FY 2017 in the Yokohama and Kawasaki region as it had last quarter. As such, trends clearly vary by region. In this quarter, the gap between Average Gross Yields on the Contract Price and on the Initial Asking Price contracted as differences in price perspectives between sellers and buyers appear to be shrinking. However, rising property prices appear to be leading to decreases in the number of transactions.
While there is encouraging news, such as post-covid recovery of consumption, demand by inbound tourists, and a favorable trend in the Nikkei Average, there are uncertainties over future economic conditions, such as soaring commodity prices at home and changes in BoJ monetary policies. It is likely to be imperative to cautiously probe consequences of such economic conditions for the real estate market.