Our Site uses cookies to improve your experience on our website. For more details, please read our Cookie Policy.
By closing this message or starting to navigate on this website, you agree to our use of cookies.
Our Site uses cookies to improve your experience on our website. For more details, please read our Cookie Policy.
By closing this message or starting to navigate on this website, you agree to our use of cookies.


Contact
Mitsui Fudosan Realty can provide a wide range of real estate services on both investment and residential properties.
Please feel free to give us a call or contact with mail inquiry.
Phone
- China400-120-1319
- HongKong800-93-3060
- Taiwan00801-81-2728
- Japan0120-923-431
- Other Regions+81-3-6758-4072

Quarterly Report for Premium Condominiums in Tokyo | 2Q FY 2023

Dear Valued Customers:
Thank you very much for your inquiry and business. We at International Dept. of Mitsui Fudosan Realty would like to share with you the trend in the high-end condominium market of central Tokyo here.
【Chart 1】
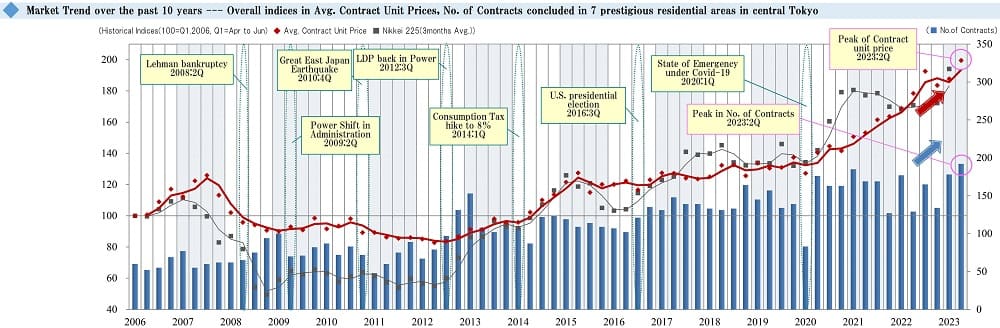
This graph shows an index of changes in average contract price per tsubo (*Notes: 1. Indexation using average contract price per tsubo in 1Q / FY 2006 as 100. 2. Tsubo is a Japanese traditional unit of area equal to approx. 3.31sqm.) and the number of contracts concluded every quarter for premium condo. units in 7 prestigious areas of central Tokyo.
Major economic events and Nikkei Stock Average are also shown for reference. The bar graph represents the number of contracts concluded each quarter. The red-line shows a movement in the index of average contract price per tsubo, while the gray-line shows one in the Nikkei stock average.
In the 2nd quarter reviewed here (July 1 thru September 30, 2023, based on the Japanese fiscal year), the index of the average contract price per tsubo for premium condominium units sold went up sharply by 11.5 points QoQ to reach 199.5, hitting a new all-time high since the beginning of data collection. This level exceeds that recorded about one year ago in the 3rd quarter of 2022 and is approximately double that at the beginning of data collection in the 1st quarter of 2006. The number of contracts concluded also increased by 14 QoQ to 192, hitting a new all-time high for the first time in about two years since the 1st quarter of 2021.
【Chart 2】
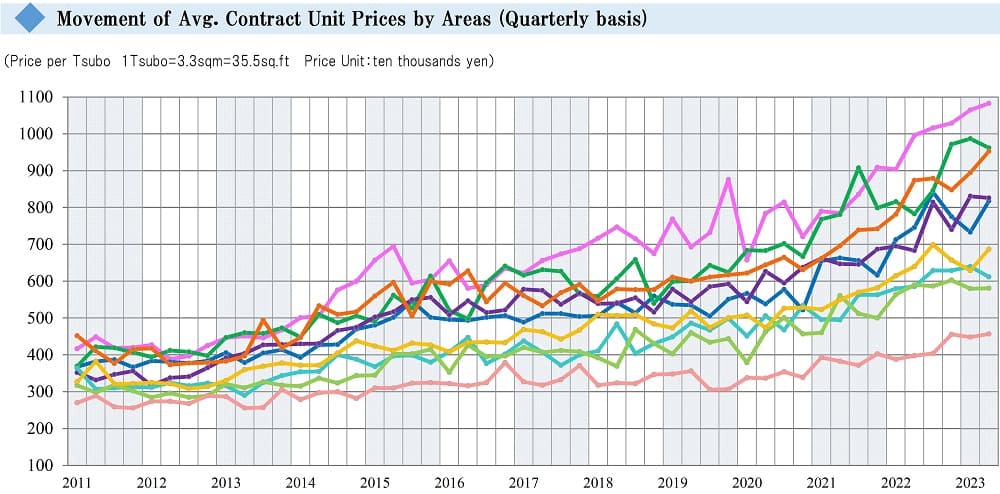
The chart above shows the average contract price per tsubo. There was a decline in the following areas: "Aoyama / Shibuya Area,” “Shirogane Takanawa / Azabu-jyuban Area,” and “Ginza Area.” On the other hand, the average contract price per tsubo remained unchanged in the “Ichigaya / Yotsuya Area,” and went up in the following five areas: “Azabu / Akasaka / Roppongi Area,” “Hiro-o / Daikanyama / Ebisu Area,” “Bancho / Kojimachi Area,” “Meguro / Shinagawa Area,” and “Setagaya / Ohta Area.” Among these, the average contract price per tsubo reached record historical highs since the beginning of data collection in the “Azabu / Akasaka / Roppongi Area,” “Bancho / Kojimachi Area,” and “Setagaya / Ohta Area”. And in case of “Azabu / Akasaka / Roppongi Area”, this is the fifth consecutive quarter to reach a new record high.
【Chart 3】
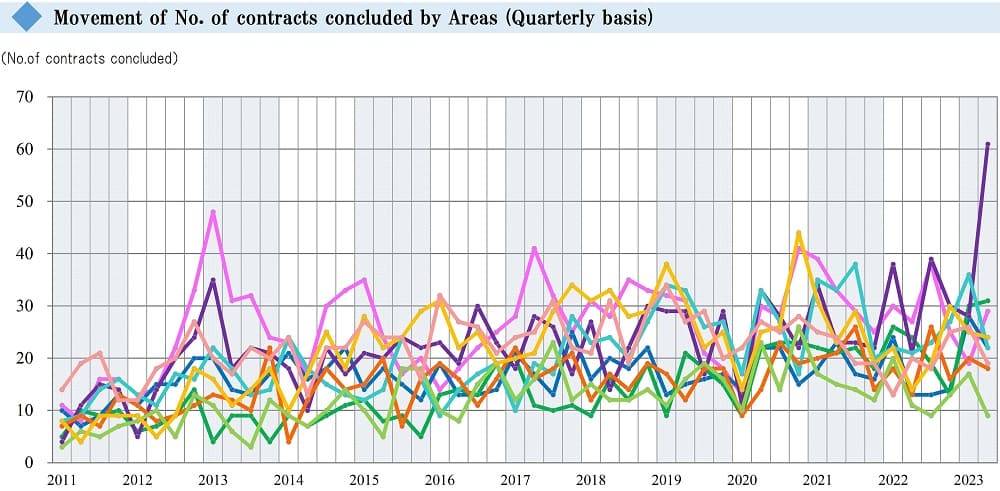
Now let's look at the chart above for the number of contracts concluded. While the number declined in four areas, i.e. “Hiro-o / Daikanyama / Ebisu Area,” “Ginza Area,” “Ichigaya / Yotsuya Area,” and “Setagaya / Ohta Area”; remained largely unchanged in the “Aoyama / Shibuya Area,” “Bancho / Kojimachi Area,” and "Meguro / Shinagawa Area”; and increased significantly by 10 in the “Azabu / Akasaka / Roppongi Area” and by 33 in the “Shirogane Takanawa / Azabu-jyuban Area,” recording an all-time high in the latter.
In summary, the overall market was robust as both the index of the average contract price per tsubo and the number of contracts concluded reached record historical highs since the beginning of data collection. However, the inventory for all the nine areas combined as of the end of this quarter was 565, remaining up compared to a level a year or two ago but decreasing sharply QoQ from 593. It will be worthwhile to note how this inventory will affect the number of contracts and the average price per tsubo in the ensuing quarters. It will be prudent to keep closely watching the impact from reselling of large-scale, recently built properties and inbound demand on top of the economic and financial situations.