Our Site uses cookies to improve your experience on our website. For more details, please read our Cookie Policy.
By closing this message or starting to navigate on this website, you agree to our use of cookies.
Our Site uses cookies to improve your experience on our website. For more details, please read our Cookie Policy.
By closing this message or starting to navigate on this website, you agree to our use of cookies.


Contact
Mitsui Fudosan Realty can provide a wide range of real estate services on both investment and residential properties.
Please feel free to give us a call or contact with mail inquiry.
Phone
- China400-120-1319
- HongKong800-93-3060
- Taiwan00801-81-2728
- Japan0120-923-431
- Other Regions+81-3-6758-4072

Investment Real Estate Market Report | 3Q FY2023

Foreword
Thank you very much for your continued support and business.
We, at Mitsui Fudosan Realty, have been providing a broad range of services in order for our valued clients to make the "Best Use" of precious assets, and attentive consultation about concerns and worries clients have with respect to assets in various conditions, not only through brokerage of business and investment properties but also by helping clients to utilize assets effectively for such purposes as estate and tax planning.
As part of these efforts, we prepare an "Investment Real Estate Market Report" for reference to help clients grasp the situation affecting real estate holdings. Since the investment real estate market is susceptible to external factors such as economic trends, an objective point of view is essential to understand the current market conditions. It is our great pleasure if this report is instrumental for readers to develop asset building strategies.
We will continue striving to deliver long-term support through development, implementation, and follow-up of plans that will satisfy clients, meet demands of each client on a "one to one" basis by making the most of professional expertise and experience gained over the years, and prove worthy of clients' trust.
Please feel free to contact us at the office below with any comments or requests concerning this report, or any matters related to real estate assets.
We look forward to opportunities to serve you soon.
Mitsui Fudosan Realty Co., Ltd.
Solution Business Division
■Toll-free Number: 0120-321-376
■Hours: 9:30 am - 6:00 pm Closed Wednesdays, Sundays
■3-2-5, Kasumigaseki, Chiyoda-ku, Tokyo 100-6019, Japan
We, at Solution Business Division of Mitsui Fudosan Realty Co., Ltd., have been producing a "Investment Real Estate Market Report" to serve as an aid to hopefully assisting our valued clients formulate a medium-to long term asset building plan.
Please also take a look at our website, which is full of useful information such as properties for sale, various consultation services, and articles by real estate experts.
Areas subject to collection of data
Tokyo Central submarket: Minato-ku, Chiyoda-ku, Chuo-ku, Shibuya-ku, Shinjuku-ku, and Bunkyo-ku
Tokyo South submarket: Shinagawa-ku, Meguro-ku, Setagaya-ku, and Ota-ku
Tokyo North / West submarket: Suginami-ku, Nakano-ku, Nerima-ku, Toshima-ku, Itabashi-ku, Kita-ku, and Taito-ku
Tokyo East submarket: Koto-ku, Sumida-ku, Arakawa-ku, Edogawa-ku, Katsushika-ku, and Adachi-ku
Yokohama / Kawasaki region: Yokohama city and Kawasaki city
Detailed descriptions
Pick Up Area: For investment real estate, trends in the average gross yields on contract price and initial asking price, together with the number of closed contracts by submarkets are represented in the graph. The details of the transition of actual market value and properties both for sale and sold in certain neighborhoods are also shown.
Market Overview: As an overview of all the submarkets, the trend from the past to this quarter is available. Trends in the average gross yields based on contract price and initial asking price together with the number of closed contracts by area are shown for comparison.
Data Source: Information is extracted from the database containing properties offered for sale and contracts concluded through Mitsui Fudosan Realty Network (En-bloc condominiums / office buildings / apartment buildings).
- Number of Transactions & Average Gross Yield on Contract Price: Number of contracts closed in a quarter (three months) and average gross yield of them (including estimated values)
- Average Gross Yield on Initial Asking Price: Quarterly average gross yield of closed contracts based on their asking price initially quoted
*Figures in each chart represent indices based on values for 1Q / FY2017 set at 100.
(Average Gross Yield on Contract Price is shown as an index to Average Gross Yield on Initial Asking Price for 1Q / FY 2017 set at 100.)
[Note] The historical data may be revised subsequently due to maintenance carried out from time to time, such as adding newly acquired data.
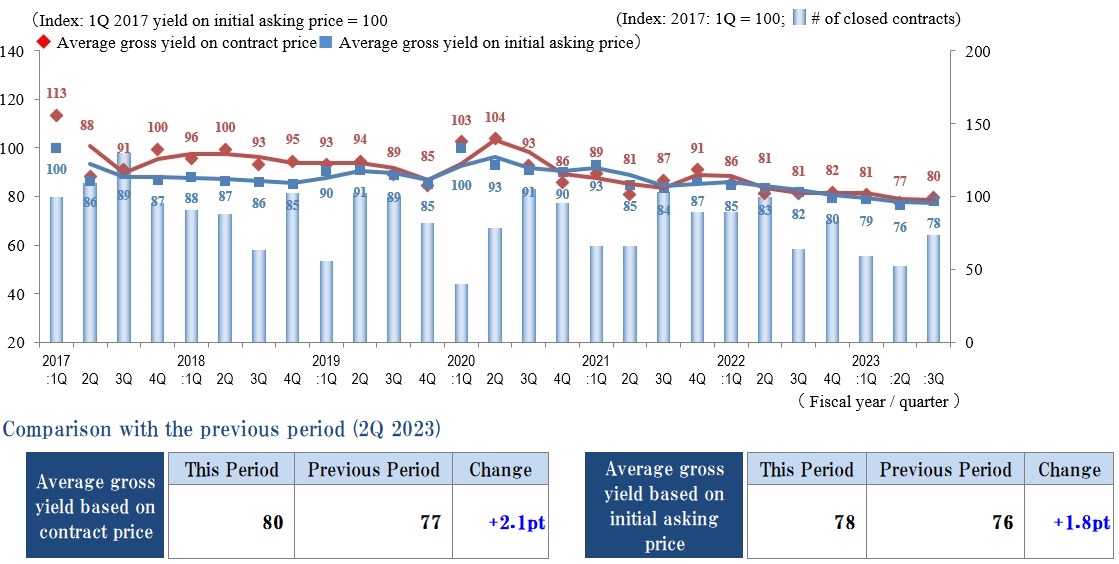
Pick Up Area -Tokyo Central submarket-
(*)Tokyo Central submarket: Minato-ku, Chiyoda-ku, Chuo-ku, Shibuya-ku, Shinjuku-ku, and Bunkyo-ku
◆Movements by Quarter: Average Gross Yield on Contract Price / Average Gross Yield on Initial Asking Price / Number of Transactions
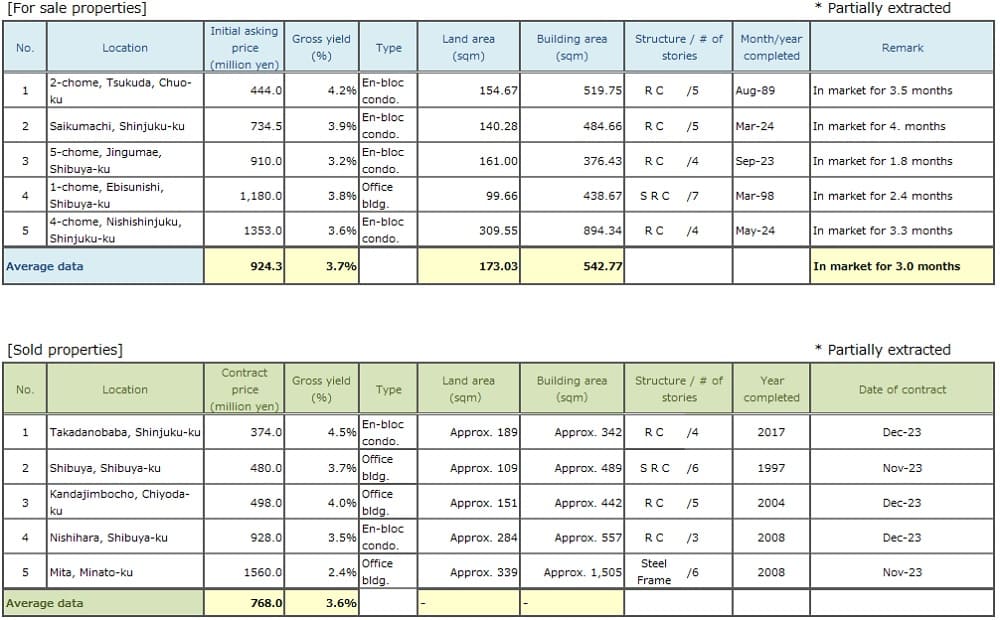
◆Brokered Transactions of Investment Real Estate in the Submarket
In 3Q / FY 2023, the Index of the Average Gross Yield was up (price decrease) in the Tokyo Central submarket on both the Contract Price and the Initial Asking Price. The trend on the Index of the Average Gross Yield on the Contract Price in particular has returned to positive territory (+2.1 pt from the previous period) at 80 after falling (price rise) steadily since 4Q / FY 2021.
The Index of the Average Gross Yield on the Initial Asking Price also rose. While the Tokyo Central submarket remined bullish, the next quarter's results should show whether the market has reached a turning point. While prices of properties offered for sale continue to rise, the gap between sellers' and buyers' expectations on prices is improving, and the number of properties sold is up somewhat from both last quarter and the same quarter of last year.
While the Nikkei Average reached a new high for the year as the BOJ decided to maintain the monetary easing policy, yields on 10-year JGBs are in an increasing trend, and interest-rate trends need to be monitored closely as they show a movement toward seeking the timing of breaking away from the negative interest-rate policy.
While yields rose on both the Contract Price and the Initial Asking Price in this quarter, few observers have pessimistic views on the real estate investment market in the Tokyo Central submarket, and the market appears likely to maintain its current status steadily.
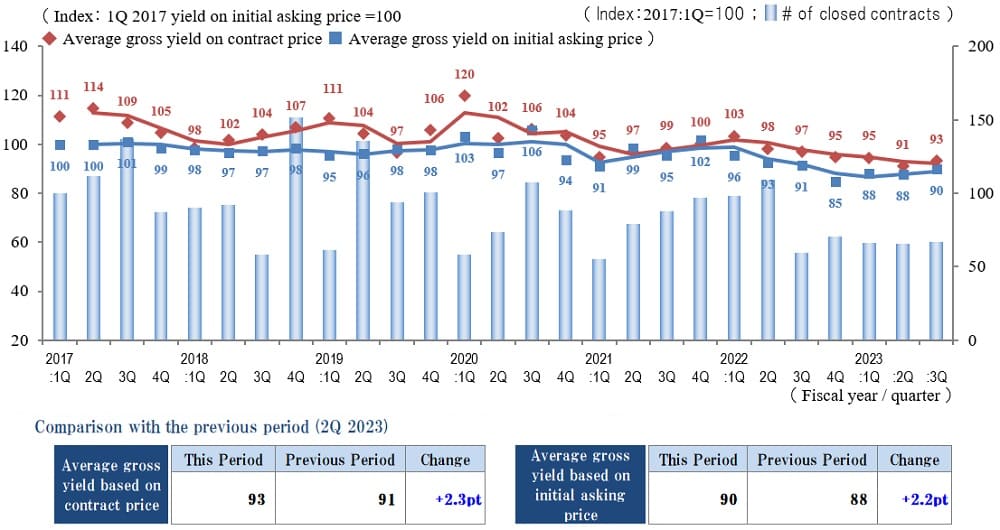
Pick Up Area -Tokyo South submarket-
(*) Tokyo South submarket: Shinagawa-ku, Meguro-ku, Setagaya-ku, and Ota-ku
◆Movements by Quarter: Average Gross Yield on Contract Price / Average Gross Yield on Initial Asking Price / Number of Transactions
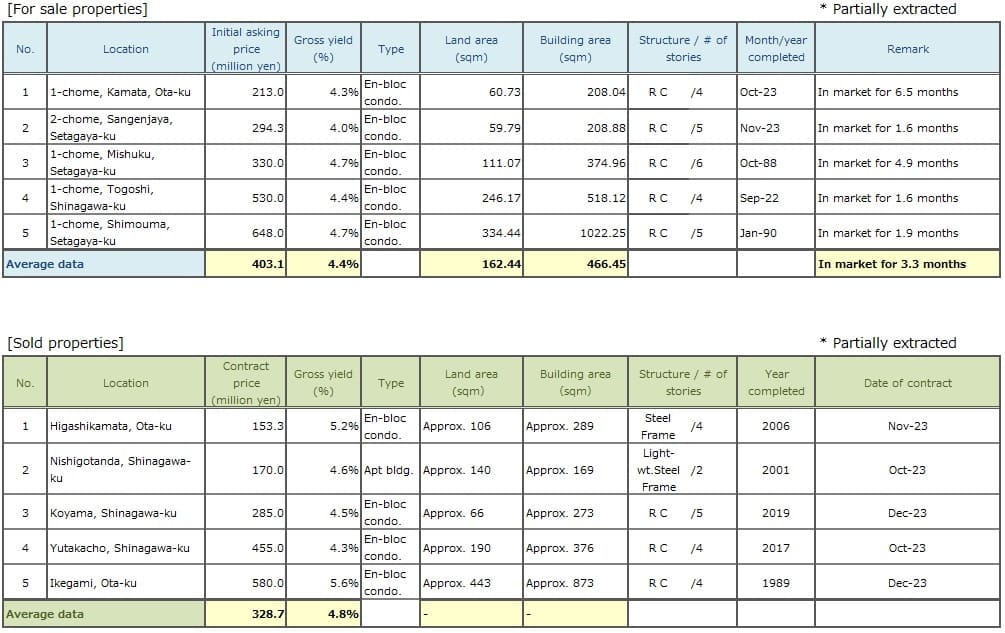
◆Brokered Transactions of Investment Real Estate in the Submarket
The Index of the Average Gross Yield on the Contract Price in the Tokyo South submarket in 3Q / FY 2023 was 93. While this level was up slightly (as prices fell) from the previous quarter (2Q / FY 2023), when it reached its lowest level since statistics began in 1Q / FY 2017, it still remains low. The Index of the Average Gross Yield on the Initial Asking Price also rose slightly QoQ to 90. The resulting gap between the Index of the Average Gross Yield on the Contract Price and the Index of the Average Gross Yield on the Initial Asking Price remained contracted at 3 pt.
In addition, while the number of transactions had continued to decrease YoY for four consecutive quarters through the previous quarter, it rose slightly QoQ this quarter for the first time in five quarters. However, the property inventory remains low and properties on the market remain scarce, and even as prices rise, it is not easy to match properties for sale with buyers' needs.
While conditions remain favorable in the real estate market in the Tokyo South submarket, since there is a possibility that it could be difficult for the number of transactions to increase in the future there is a need to closely monitor the trends in properties on the market and number of transactions.
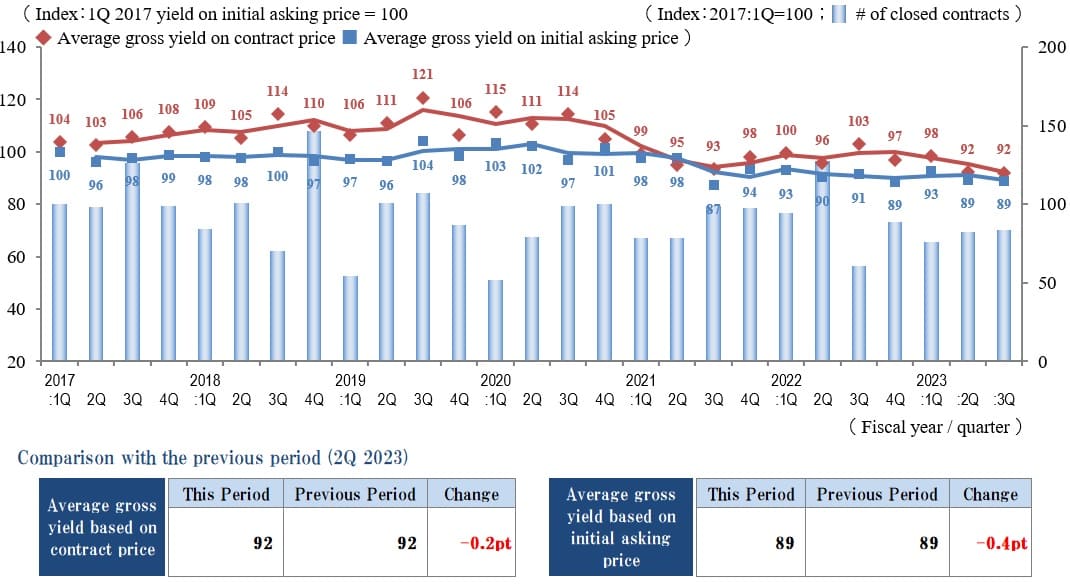
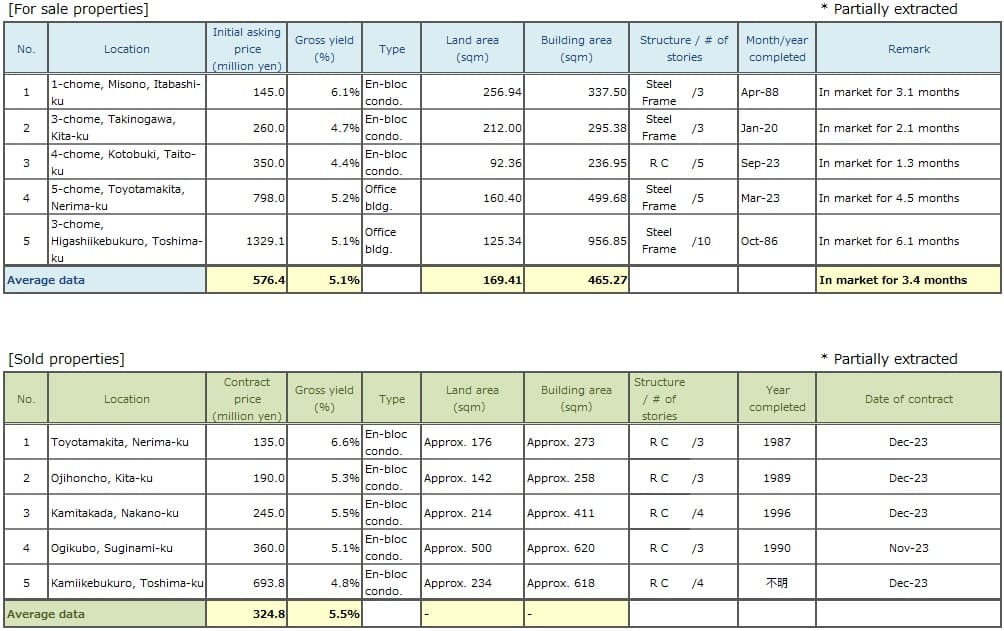
Pick Up Area -Tokyo North / West submarket-
(*) Tokyo North / West submarket: Suginami-ku, Nakano-ku, Nerima-ku, Toshima-ku, Itabashi-ku, Kita-ku, and Taito-ku
◆Movements by Quarter: Average Gross Yield on Contract Price / Average Gross Yield on Initial Asking Price / Number of Transactions
◆Brokered Transactions of Investment Real Estate in the Submarket
In the Tokyo North / West submarket in 3Q / FY 2023, the Index of the Average Gross Yield on the Contract Price was unchanged QoQ, and the Index of the Average Gross Yield on the Initial Asking Price also was largely unchanged QoQ at 89. While the number of transactions held to the same level as the last quarter, it was up sharply YoY.
The Index of the Average Gross Yield on the Contract Price in the Tokyo South submarket in the previous quarter (2Q / FY 2023) reached its lowest level since statistics began in 1Q / FY 2017. It remains at the same level this quarter as conditions can be said to remain favorable in the real estate investment market in this submarket. Active inbound investment spurred by the devalued yen, chiefly in central Tokyo, also is likely to be one factor behind the bullish market conditions.
While conditions are favorable for some submarkets and properties, since some properties appear to have remained on the market for some time, such as those in less desirable locations like the outskirts or at a distance from railway stations, the real estate market continues to show a trend toward bipolarization.
A wide range of domestic and international topics lurks in the background, such as the international situation, BOJ monetary policy, continuing inflation, and the effects of amended labor laws in 2024. It will be essential to monitor constantly what kind of effect such factors have on the domestic market for investment real estate in the future.
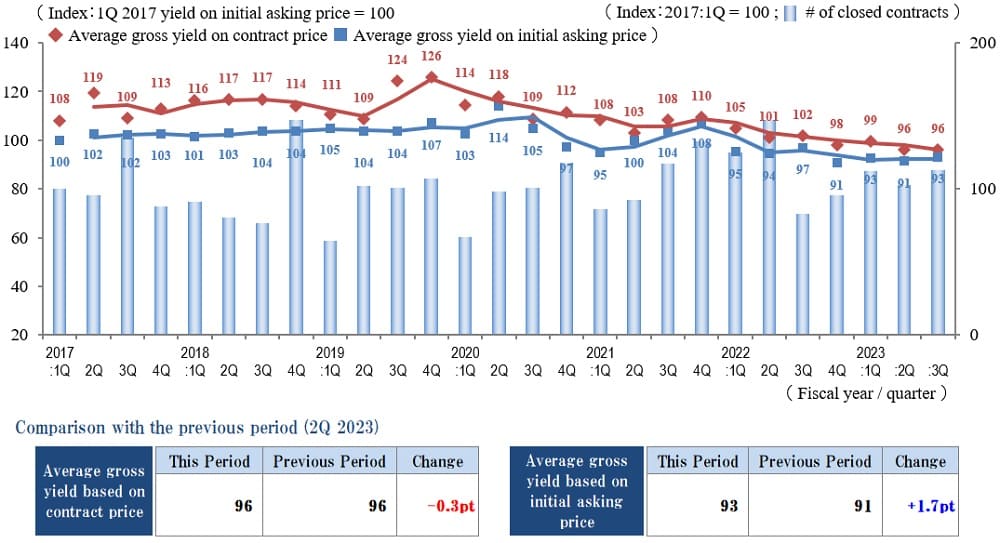
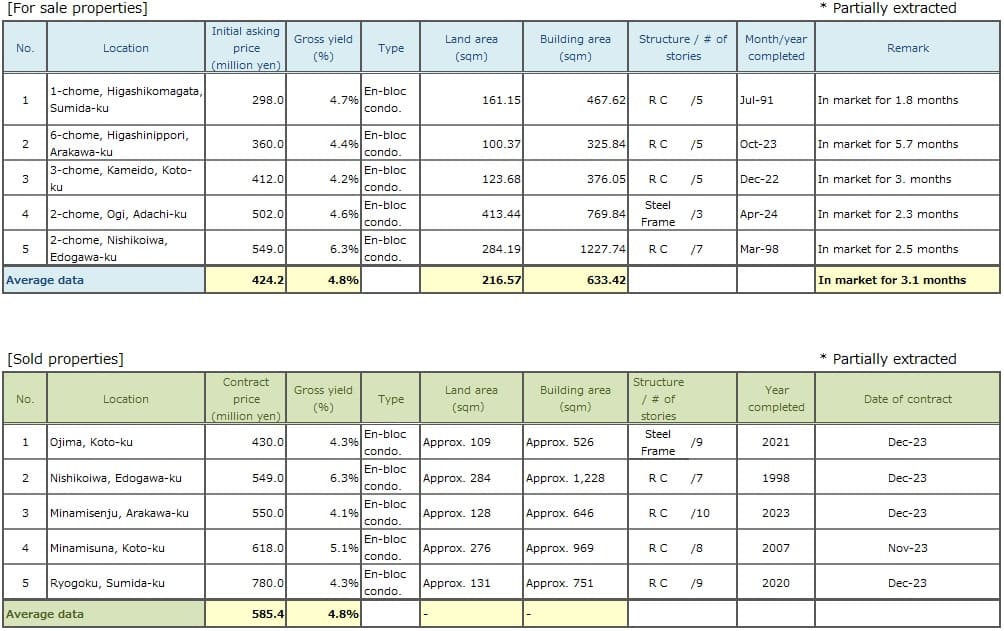
Pick Up Area -Tokyo East submarket-
(*) Tokyo East submarket: Koto-ku, Sumida-ku, Arakawa-ku, Edogawa-Ku, Katsushika-ku, and Adachi-ku
◆Movements by Quarter: Average Gross Yield on Contract Price / Average Gross Yield on Initial Asking Price / Number of Transactions
◆Brokered Transactions of Investment Real Estate in the Submarket
The Indices of the Average Gross Yield on the Contract Price and the Initial Asking Price in the Tokyo East submarket in 3Q / FY 2023 here were 96 and 93 (up 1.7 pt QoQ), respectively. The Index of the Average Gross Yield on the Initial Asking Price is stable. It has remained largely unchanged for a year, and the gap between it and the Index of the Average Gross Yield on the Contract Price is small.
While the real estate market in this submarket can be said to be maintaining a steady tone, it is becoming more difficult from year to year for investors and businesses that acquired properties at high prices (low yields) to achieve exit strategies over the relatively short term. Increasing numbers of prospective buyers report being unable to acquire the properties due to price expectation gap, while at the same time cases are apparent of properties that fail to satisfy buyers' desired standards remaining unsold or on the market for lengthy periods as risk-averse buyers refuse to go too far out of their way to acquire them.
Various factors are combining recently to contribute to fluctuations in real estate prices, including high and rising prices of new construction due to skyrocketing building material costs and the labor shortage, unstable fund raising as interest rates rise, and the possibility of a change in consumer confidence. Taking an overview of market conditions and judging the future outlook are becoming increasingly essential.
Pick Up Area -Yokohama / Kawasaki region-
(*) Yokohama and Kawasaki region: Yokohama city, Kawasaki city
◆Movements by Quarter: Average Gross Yield on Contract Price / Average Gross Yield on Initial Asking Price / Number of Transactions
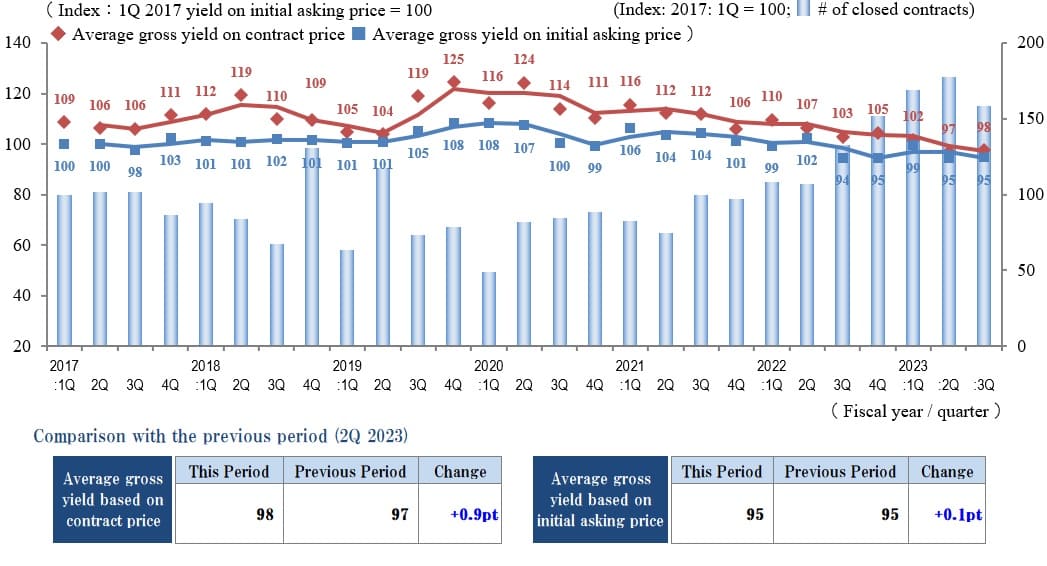
◆Brokered Transactions of Investment Real Estate in the Submarket
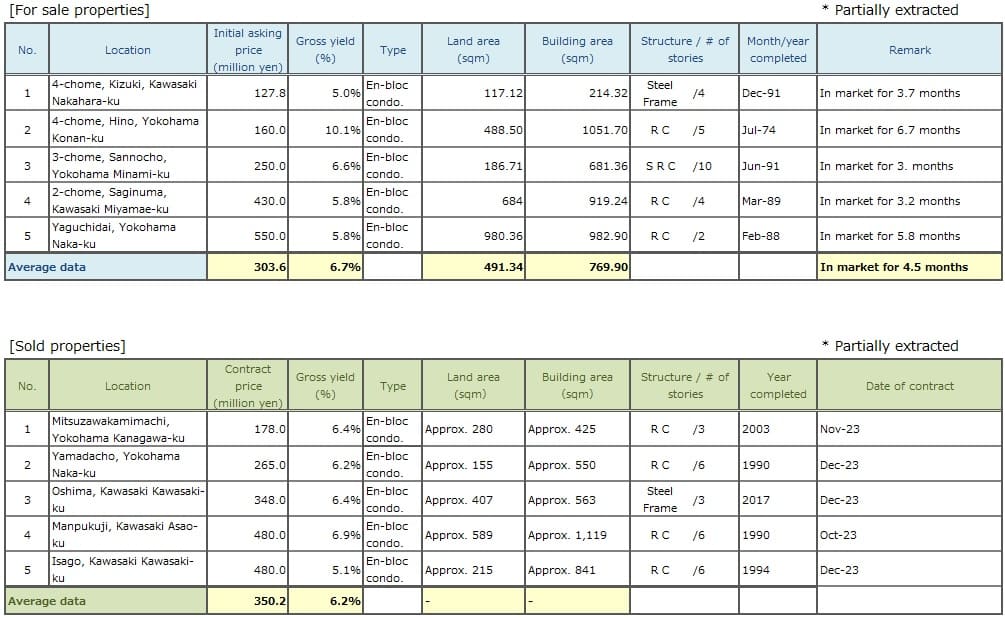
The number of transactions in the Yokohama / Kawasaki region in 3Q / FY 2023 was up sharply YoY but down QoQ (vs. 2Q). This was the first QoQ decrease in number of transactions since 2Q / FY 2022. It will be essential to monitor the next quarter's trends to see whether this indicates a cooling of the market out of concern that it may have overheated.
At the same time, transaction yields remain largely unchanged QoQ, and there appears to be no marked change in valuation of prices of revenue-generating real estate itself on the investors' side.
However, looking at individual transaction details, there were cases of large disparities between properties centrally located and in commercial districts and properties located in suburban areas or inconvenient locations in terms of pricing and the duration required until concluding contracts. This tendency to bipolarization has become increasingly evident here.
Construction costs also remain high, and cases were apparent here and there of pressure on land purchase costs in transactions as cutting other costs was not enough to compensate for high construction costs. The impact of this trend is particularly large in suburban areas where land prices are lower than in central Tokyo. There can be expected to be a possibility of further decreases in the prices of commercial sites.
While the risk of a short-term fluctuation in the revenue-generating real estate market is not considered to be high as stock prices remain steady, there is likely to be a need to monitor trends in interest rates and investor attitudes closely for the time being.
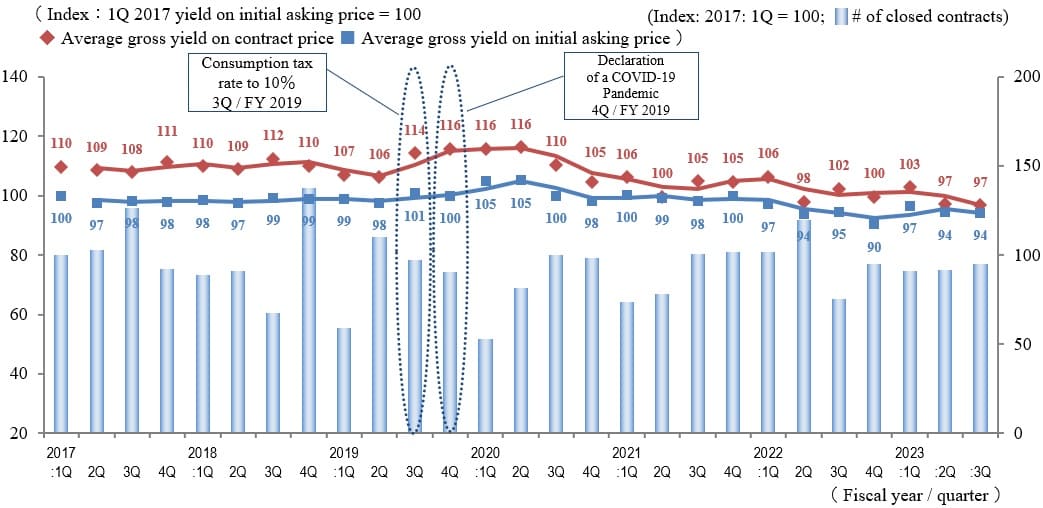
General overview
◆Movements by Quarter: Average Gross Yield on Contract Price / Average Gross Yield on Initial Asking Price / Number of Transactions for the 5 Areas
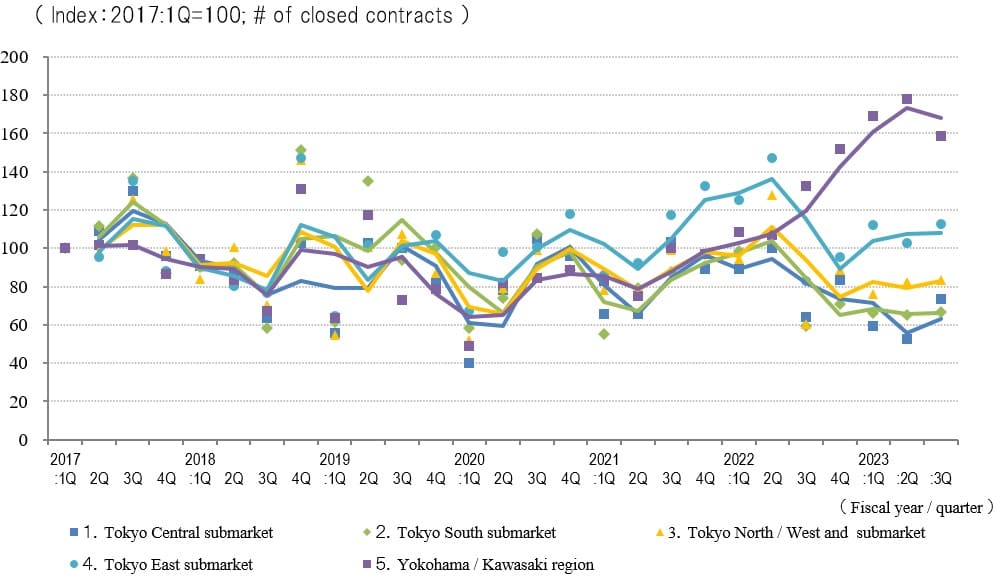
◆Movements in Number of Transactions by Area
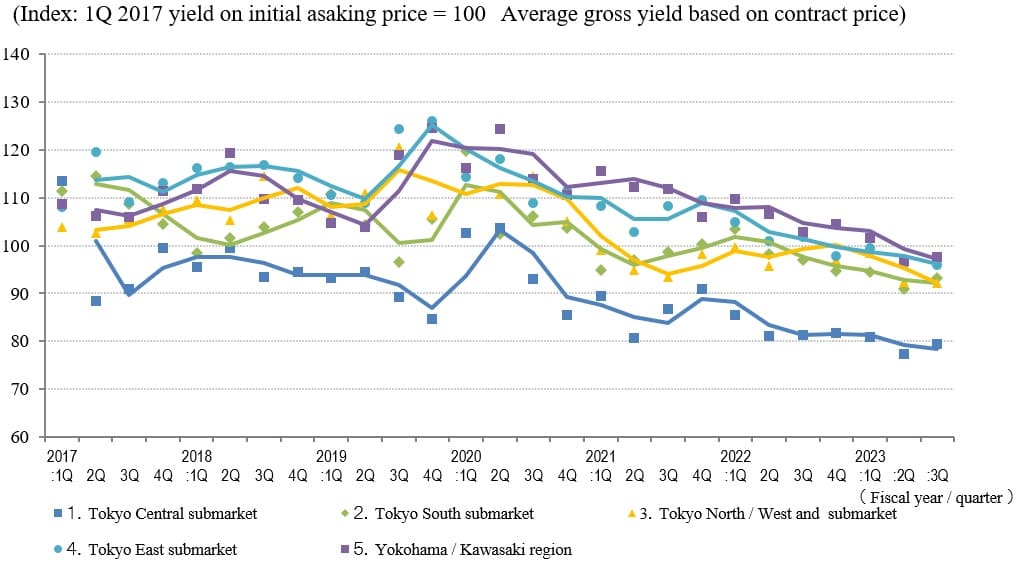
◆Movements in Average Gross Yield on Contract Price by Area
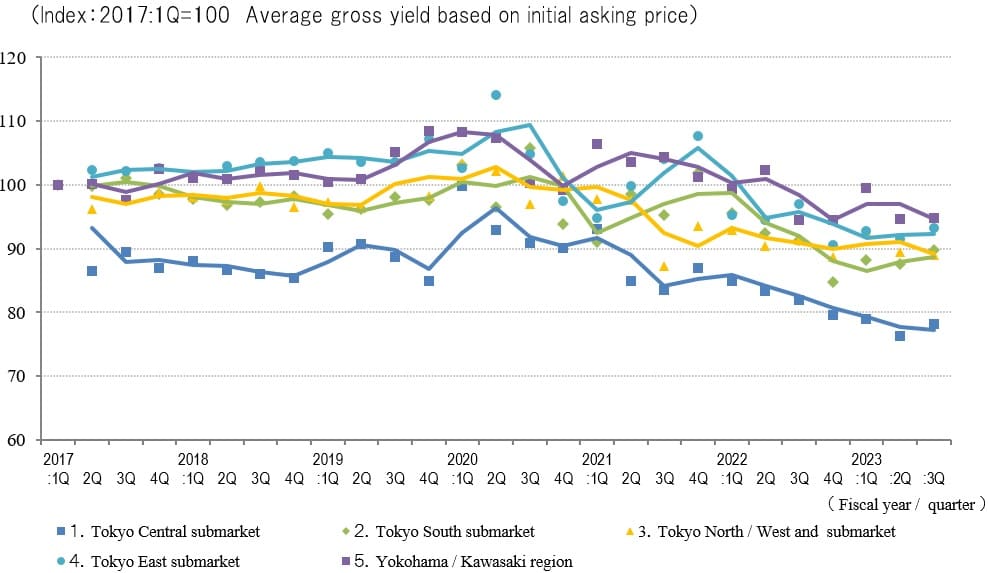
◆Movements in Average Gross Yield on Initial Asking Price by Area
A look at yield trends by submarket in 3Q / 2023 shows that Average Gross Yield on the Contract Price was unchanged in Tokyo North / West, Tokyo East, Yokohama / Kawasaki and increased slightly in the Tokyo Central and Tokyo South submarkets. Although it rose in some submarkets, it remained largely unchanged for the market as a whole, sticking to the low level it has maintained since 2017. The increase in yields in the Tokyo Central submarket appears to represent a rebound from record low yields last quarter.
The Average Gross Yield on the Initial Asking Price remained unchanged in Tokyo North / West and Yokohama / Kawasaki while rising slightly QoQ in the other three submarkets. Since both yields were in equilibrium with disparities of 2-3 pts between the Yield on the Contract Price and the Yield on the Initial Asking Price in each submarket, conditions in the investment real estate market can be said to remain steady.
The number of transactions was up QoQ in Tokyo Central and Tokyo East and up slightly in Tokyo South and Tokyo North / West. While it was down in Yokohama / Kawasaki, the number of transactions in that submarket was still at its third highest level since 2017.
Domestic and international stock markets have been bullish since the start of the year, and various indicators, such as the BOJ short-term DI indicate favorable economic conditions. However, there is a need to closely monitor such matters as interest-rate trends, which have a major impact on the real estate market. For example, the timing of an end to the BOJ negative interest rate policy is a current topic of concern.