Our Site uses cookies to improve your experience on our website. For more details, please read our Cookie Policy.
By closing this message or starting to navigate on this website, you agree to our use of cookies.
Our Site uses cookies to improve your experience on our website. For more details, please read our Cookie Policy.
By closing this message or starting to navigate on this website, you agree to our use of cookies.
This page is translated using machine translation. Please note that the content may not be 100% accurate.


Contact
Mitsui Fudosan Realty can provide a wide range of real estate services on both investment and residential properties.
Please feel free to give us a call or contact with mail inquiry.
Phone(English Line)
Contact Information by Region
- China400-120-1319
- HongKong800-93-3060
- Taiwan00801-81-2728
- Japan(English)0120-923-431
- Other Regions+81-3-6758-4072
This page is translated using machine translation. Please note that the content may not be 100% accurate.

Quarterly Report for Premium Condominiums in Tokyo | 3Q FY 2021
【Chart 1】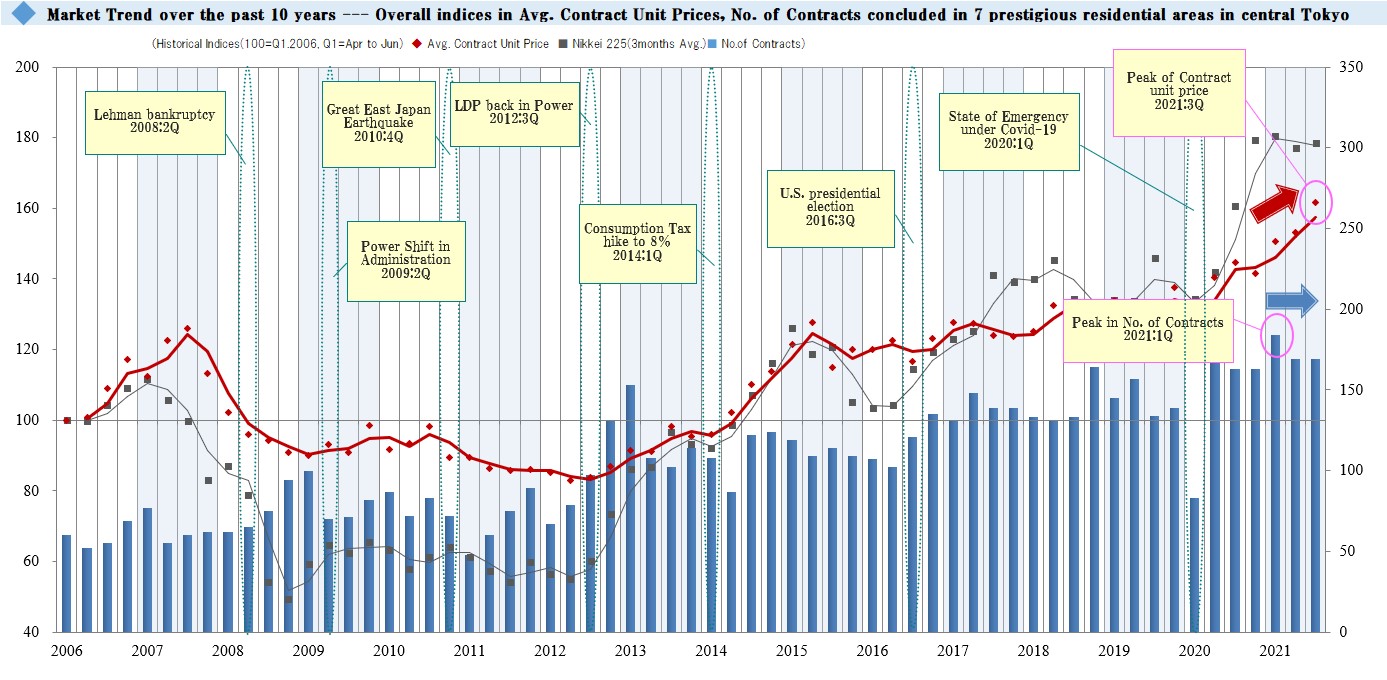
This graph indicates the trends in average contract price per tsubo (*Tsubo is Japanese traditional way of measurement: approx.3.31sqm, and the prices above are index-based) and number of contracts concluded in 7 prestigious areas of Central Tokyo. Major economic events and Nikkei Stock Average are also provided for an objective comparison. The bar graph shows the number of contracts concluded. The red-line shows the average contract price per tsubo, while the gray-line shows the Nikkei stock average.
In the 3rd quarter reviewed here (Oct 1 - Dec 31, 2021 based on Japanese fiscal year), the average contract price per tsubo recorded its highest figures since the beginning of data collection in 2006. Because the average contract price per tsubo in the 1st quarter (Apr 1 - Jun 30, 2021) and the 2nd quarter (Jul 1 - Sep 30, 2021) broke its previous highest record, we set new highs three quarters in a row. On the other hand, the number of contracts concluded in this quarter remained the same as last quarter (2nd quarter: Jul 1 - Sep 30, 2021) at 169. Compared with the number of contracts concluded during the state of emergency under COVID-19 last year, the number has been keeping a high level of over 160 contracts.
【Chart 2】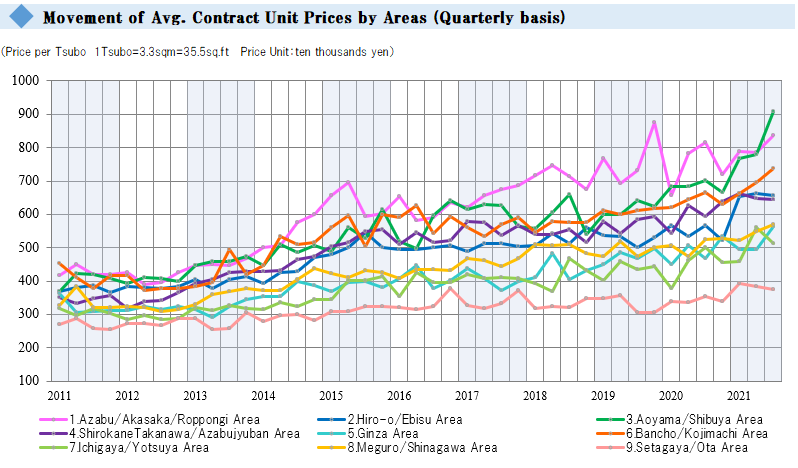
【Chart 3】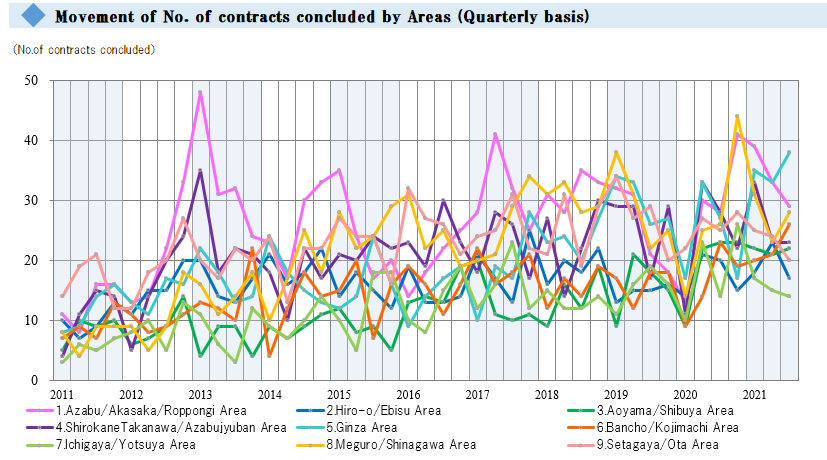
From this paragraph, let’s take a look at the market trends by areas. The line graphs 1-9 at the chart 2 above indicate the average contract price per tsubo for 9 different areas (1. Azabu, Akasaka and Roppongi/ 2. Hiro and Ebisu/ 3. Aoyama and Shibuya/ 4. Shirokane-takanawa and Azabujuban/ 5. Ginza /6. Bancho and Kojimachi/ 7. Ichigaya and Yotsuya / 8. Meguro and Shinagawa/9. Setagaya and Ota), while the line graphs 1-9 at the chart 3 below indicate the number of contracts concluded in those areas.
In five areas: “Azabu, Akasaka and Roppongi”, “Aoyama and Shibuya”, “Ginza”, “Bancho and Kojimachi”, and “Meguro and Shinagawa”, the average contract price per tsubo rose from the last quarter. Especially, in “Aoyama and Shibuya”, “Ginza”, “Bancho and Kojimachi”, and “Meguro and Shinagawa”, it recorded the highest figures since the beginning of data collection. Furthermore, “Aoyama and Shibuya”, “Bancho and Kojimachi”, and “Meguro and Shinagawa” have shattered their highest figures for the past two quarters in a row.
The number of contracts increased in four areas: “Aoyama and Shibuya”, “Ginza”, “Bancho and Kojimachi”, and “Meguro and Shinagawa”.Especially, “Ginza” and “Bancho and Kojimachi” recorded the highest figures in the number of contracts concluded since the beginning of data collection. With such positive trends in Tokyo, high-end condo market has still been very robust and active even amid COVID-19 crisis.
If you are interested in purchasing a property in Tokyo or selling your property in Tokyo or other areas in Japan, this is a good chance to find a right opportunity so please do not hesitate to contact us.
We are always looking forward to supporting your needs.
Thank you and best regards,
International Dept. Mitsui Fudosan Realty Co., Ltd.
E-mail : tokyoproperty@mf-realty.jp
Phone : +81-3-6758-4019
Toll free (from Japan): 0120-599-321
Office Hour: 10:00 am – 6:00pm (Japan Time)
Office Closed: Saturdays, Sundays and National holidays