Our Site uses cookies to improve your experience on our website. For more details, please read our Cookie Policy.
By closing this message or starting to navigate on this website, you agree to our use of cookies.
Our Site uses cookies to improve your experience on our website. For more details, please read our Cookie Policy.
By closing this message or starting to navigate on this website, you agree to our use of cookies.
This page is translated using machine translation. Please note that the content may not be 100% accurate.


Contact
Mitsui Fudosan Realty can provide a wide range of real estate services on both investment and residential properties.
Please feel free to give us a call or contact with mail inquiry.
Phone(English Line)
Contact Information by Region
- China400-120-1319
- HongKong800-93-3060
- Taiwan00801-81-2728
- Japan(English)0120-923-431
- Other Regions+81-3-6758-4072
This page is translated using machine translation. Please note that the content may not be 100% accurate.

Quarterly Report for Premium Condominiums in Tokyo | 4Q FY 2023
【Chart 1】
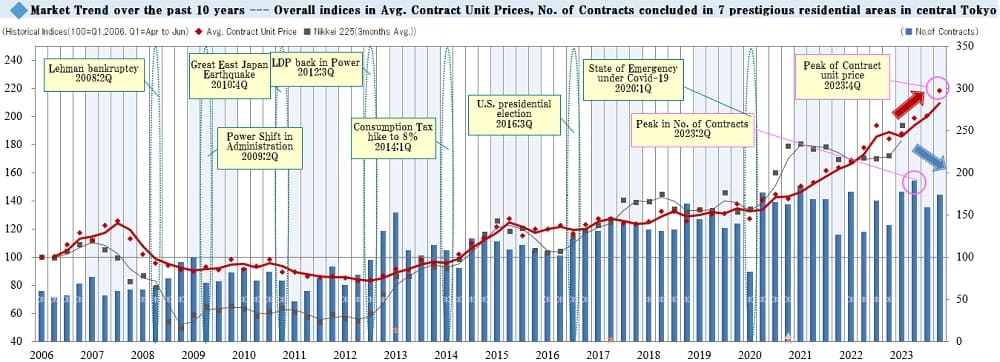
This graph shows an index of changes in average contract price per tsubo (*Notes: 1. Indexation using average contract price per tsubo in 1Q / FY 2006 as 100. 2. Tsubo is a Japanese traditional unit of area equal to approx. 3.31sqm.) and the number of contracts concluded every quarter for premium condo. units in 7 prestigious areas of central Tokyo.
Major economic events and Nikkei Stock Average are also shown for reference. The bar graph represents the number of contracts concluded each quarter. The red-line shows a movement in the index of average contract price per tsubo, while the gray-line shows one in the Nikkei stock average.
In the 4th quarter reviewed here (Jan 1 – Mar 31, 2024), the index of the average contract price per tsubo for premium condominium units sold went up by +18.1 points QoQ to reach 218.8, hitting a new all-time high since the beginning of data collection for the three consecutive quarters. At the same time, the number of contracts concluded grew by 15 QoQ to 174, reversing a downward trend of the previous quarter.
【Chart 2】
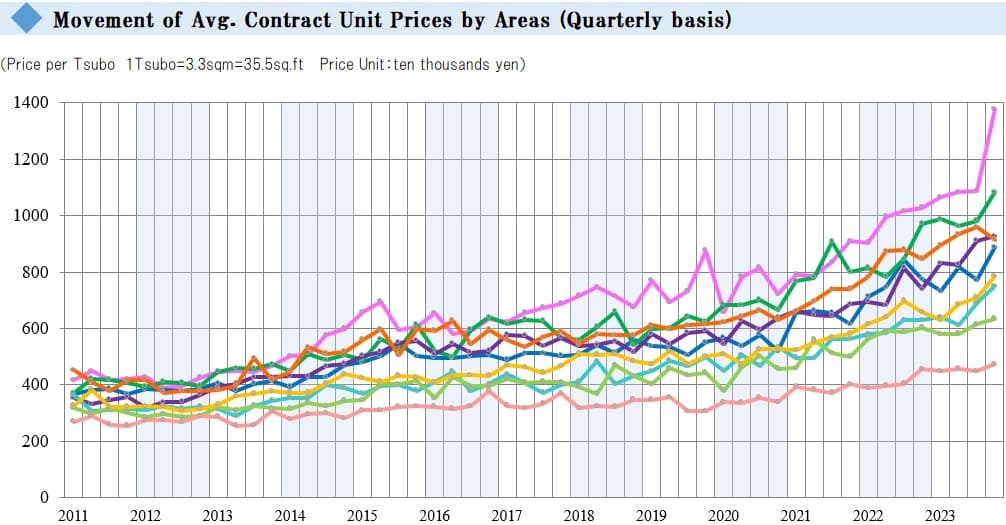
Firstly, the chart above shows average contract price per tsubo. There were increases in all eight areas other than the “Bancho / Kojimachi Area” this quarter. Each of the eight areas went up to record historical highs since the beginning of data collection. Among these, the four areas of the “Shirogane Takanawa / Azabu-jyuban Area,” "Ginza Area," “Ichigaya / Yotsuya Area,” and “Meguro / Shinagawa Area” has hit their highest figures for the second consecutive quarter, while the “Azabu / Akasaka / Roppongi Area” reached a new record high for the seventh consecutive quarter and grew sharply by more than 2.9 million yen QoQ.
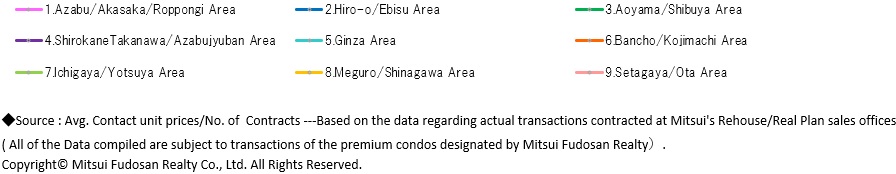
【Chart 3】
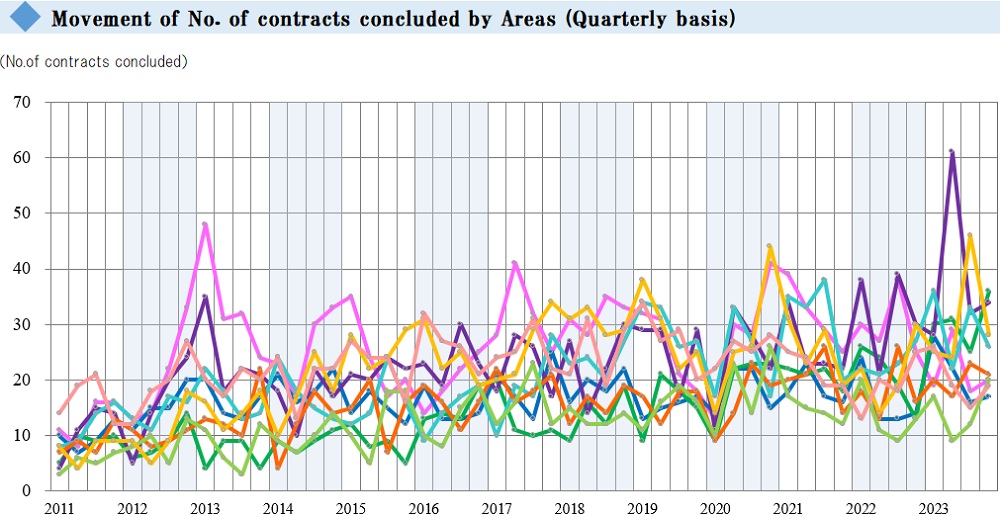
Secondly, the chart above shows the number of contracts. There were declines in the following three areas: "Ginza Area," “Bancho / Kojimachi Area,” and “Meguro / Shinagawa Area.” Among these, the “Meguro / Shinagawa Area” showed an especially large decline of more than 10 contracts. On the other hand, the number of contracts went up in the six areas of the “Azabu / Akasaka / Roppongi Area” “Hiro-o / Ebisu Area,” “Aoyama / Shibuya Area,” “Shirogane Takanawa / Azabu-jyuban Area,” “Ichigaya / Yotsuya Area,” and “Setagaya / Ohta Area.” In particular, the “Aoyama / Shibuya Area” hit an all-time high since the beginning of data collection, with an increase of more than 10 contracts QoQ.
The number of contracts began to increase this quarter, and the average price per tsubo hit a new all-time high for the third consecutive quarter. The number of listings in the market for all the nine areas combined as of the end of this quarter was 472, declining for the fourth consecutive quarter. It will be worthwhile to note how this inventory will affect the number of contracts and the average price per tsubo in the ensuing quarters. It will be prudent to keep closely watching the impact from reselling of recently constructed large-scale developments and demand from overseas investors on top of the economic and financial situations.