Our Site uses cookies to improve your experience on our website. For more details, please read our Cookie Policy.
By closing this message or starting to navigate on this website, you agree to our use of cookies.
This page is translated using machine translation. Please note that the content may not be 100% accurate.
Investment Real Estate Market Report | 1Q FY2024
Foreword
Thank you very much for your continued support and business.
We, at Mitsui Fudosan Realty, have been providing a broad range of services in order for our valued clients to make the "Best Use" of precious assets, and attentive consultation about concerns and worries clients have with respect to assets in various conditions, not only through brokerage of business and investment properties but also by helping clients to utilize assets effectively for such purposes as estate and tax planning.
As part of these efforts, we prepare an "Investment Real Estate Market Report" for reference to help clients grasp the situation affecting real estate holdings. Since the investment real estate market is susceptible to external factors such as economic trends, an objective point of view is essential to understand the current market conditions. It is our great pleasure if this report is instrumental for readers to develop asset building strategies.
We will continue striving to deliver long-term support through development, implementation, and follow-up of plans that will satisfy clients, meet demands of each client on a "one to one" basis by making the most of professional expertise and experience gained over the years, and prove worthy of clients' trust.
Please feel free to contact us at the office below with any comments or requests concerning this report, or any matters related to real estate assets.
We look forward to opportunities to serve you soon.
Mitsui Fudosan Realty Co., Ltd.
Solution Business Division
■Toll-free Number: 0120-321-376
■Hours: 9:30 am - 6:00 pm Closed Wednesdays, Sundays
■3-2-5, Kasumigaseki, Chiyoda-ku, Tokyo 100-6019, Japan
We, at Solution Business Division of Mitsui Fudosan Realty Co., Ltd., have been producing a "Investment Real Estate Market Report" to serve as an aid to hopefully assisting our valued clients formulate a medium-to long term asset building plan.
Please also take a look at our website, which is full of useful information such as properties for sale, various consultation services, and articles by real estate experts.
Areas subject to collection of data
Tokyo Central submarket: Minato-ku, Chiyoda-ku, Chuo-ku, Shibuya-ku, Shinjuku-ku, and Bunkyo-ku
Tokyo South submarket: Shinagawa-ku, Meguro-ku, Setagaya-ku, and Ota-ku
Tokyo North / West submarket: Suginami-ku, Nakano-ku, Nerima-ku, Toshima-ku, Itabashi-ku, Kita-ku, and Taito-ku
Tokyo East submarket: Koto-ku, Sumida-ku, Arakawa-ku, Edogawa-ku, Katsushika-ku, and Adachi-ku
Yokohama / Kawasaki region: Yokohama city and Kawasaki city
Detailed descriptions
Pick Up Area: For investment real estate, trends in the average gross yields on contract price and initial asking price, together with the number of closed contracts by submarkets are represented in the graph. The details of the transition of actual market value and properties both for sale and sold in certain neighborhoods are also shown.
Market Overview: As an overview of all the submarkets, the trend from the past to this quarter is available. Trends in the average gross yields based on contract price and initial asking price together with the number of closed contracts by area are shown for comparison.
Data Source: Information is extracted from the database containing properties offered for sale and contracts concluded through Mitsui Fudosan Realty Network (En-bloc condominiums / office buildings / apartment buildings).
- Number of Transactions & Average Gross Yield on Contract Price: Number of contracts closed in a quarter (three months) and average gross yield of them (including estimated values)
- Average Gross Yield on Initial Asking Price: Quarterly average gross yield of closed contracts based on their asking price initially quoted
*Figures in each chart represent indices based on values for 1Q / FY2017 set at 100.
(Average Gross Yield on Contract Price is shown as an index to Average Gross Yield on Initial Asking Price for 1Q / FY 2017 set at 100.)
[Note] The historical data may be revised subsequently due to maintenance carried out from time to time, such as adding newly acquired data.
Pick Up Area -Tokyo Central submarket-
(*)Tokyo Central submarket: Minato-ku, Chiyoda-ku, Chuo-ku, Shibuya-ku, Shinjuku-ku, and Bunkyo-ku
◆Movements by Quarter: Average Gross Yield on Contract Price / Average Gross Yield on Initial Asking Price / Number of Transactions
◆Brokered Transactions of Investment Real Estate in the Submarket
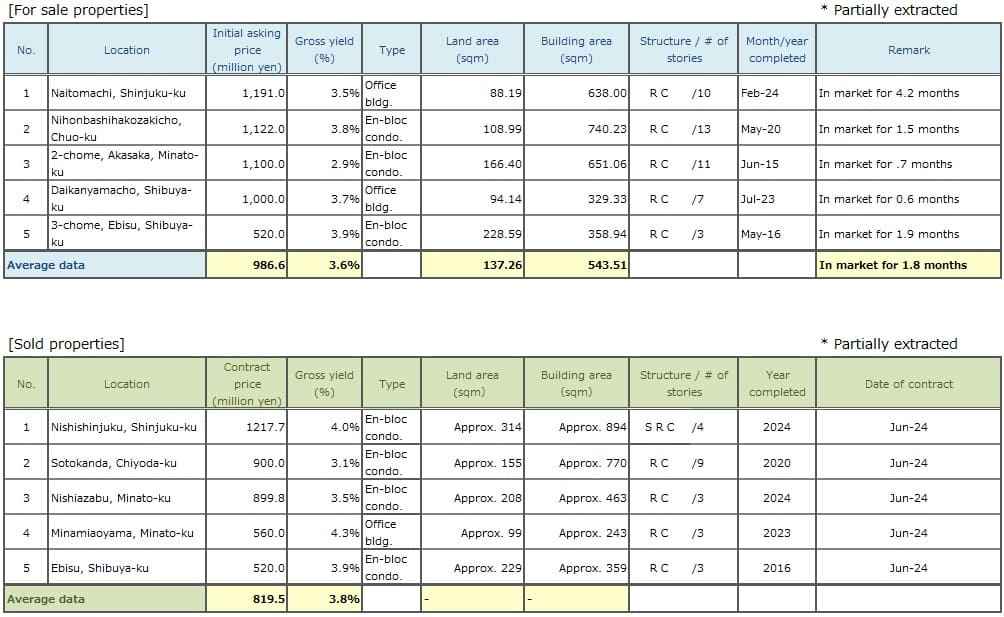
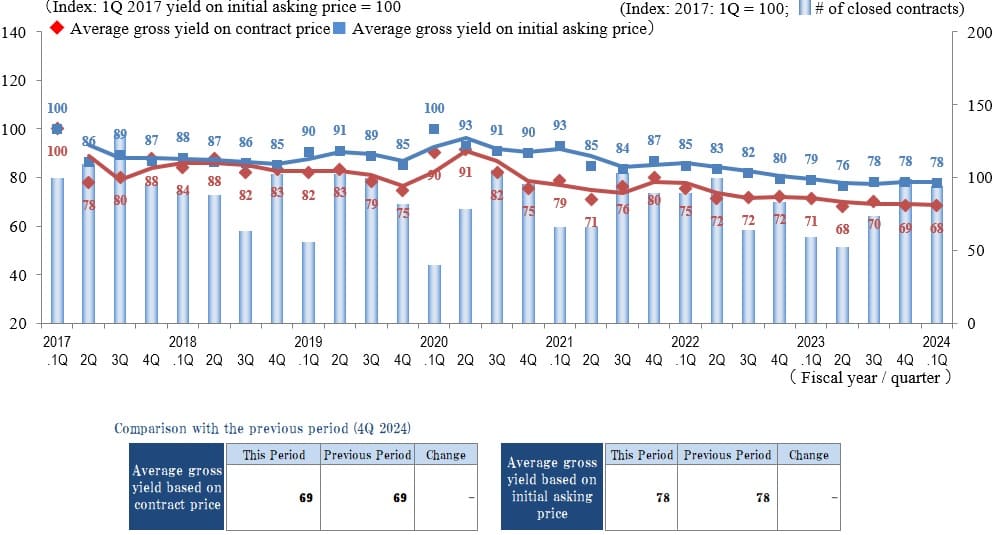
In 1Q/FY 2024 both the Index of the Average Gross Yield on the Initial Asking Price and the Index of the Average Gross Yield on the Contract Price remained largely unchanged in the Tokyo Central submarket, as favorable market conditions continue. While the number of transactions contracted was down somewhat from 4Q/FY 2023, it showed an increasing trend YoY.
Favorable signs regarding trading activity in investment real estate in the central Tokyo leading market include improvements from last fiscal year in residential and office vacancy rates, expectations that the increasing trend in rents will continue for the time being, and the positive effects of the rapid recovery in inbound consumption on retail business results. Rents are rising centered on street-level stores in name-brand areas in particular.
At the same time, future risks include upward pressure on investment yields due to such factors as continued inflation, interest rate trends (concern about further BoJ rate hikes in H2/FY 2024), and financial-market volatility. These still need to be monitored closely.
Overall, the majority view continues to be the relatively optimistic one that favorable conditions should continue as the real estate investment market in the Tokyo Central submarket remains steady or improves slightly, supported by improved vacancy rates and rising rents.
Pick Up Area -Tokyo South submarket-
(*) Tokyo South submarket: Shinagawa-ku, Meguro-ku, Setagaya-ku, and Ota-ku
◆Movements by Quarter: Average Gross Yield on Contract Price / Average Gross Yield on Initial Asking Price / Number of Transactions
◆Brokered Transactions of Investment Real Estate in the Submarket
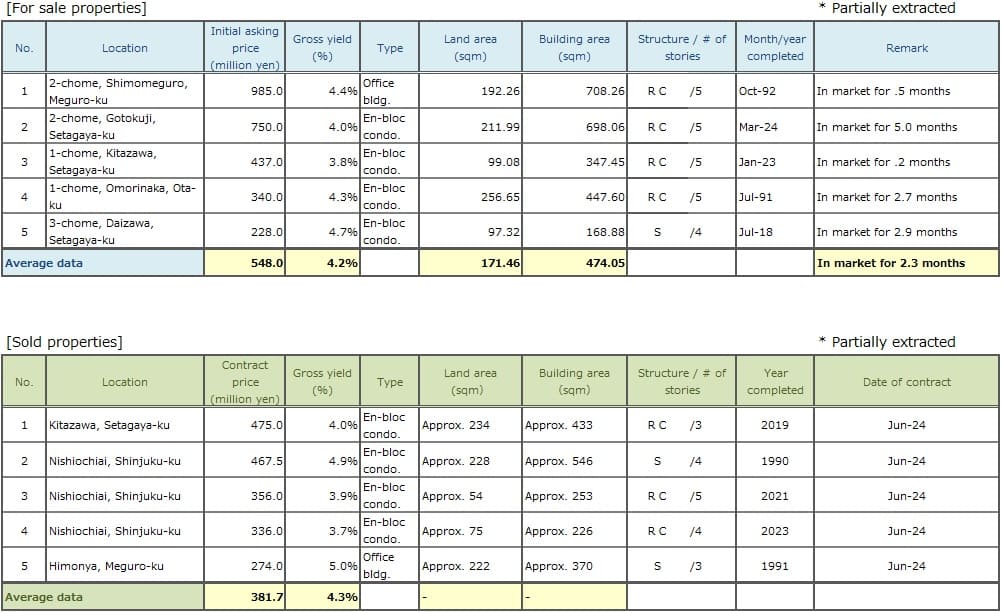
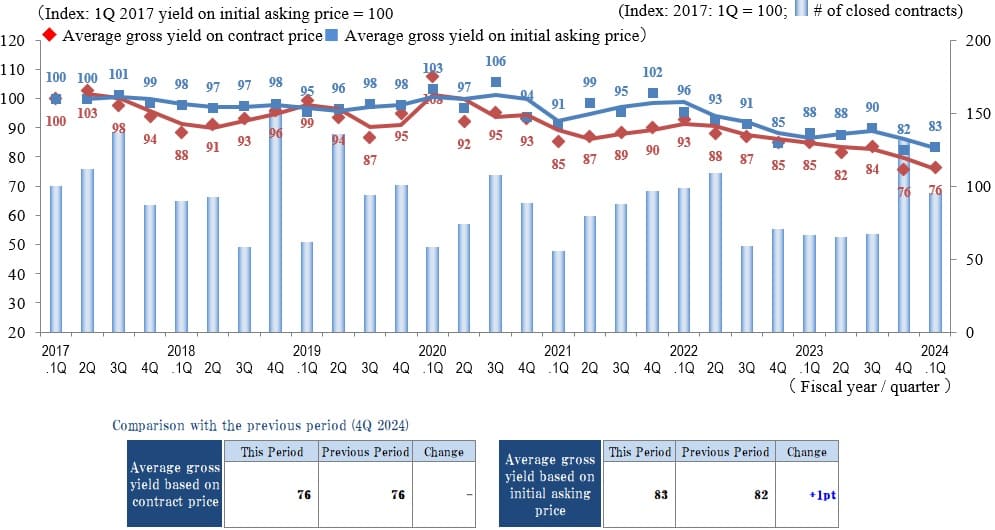
In 1Q/FY 2024, the Index of the Average Gross Yield on the Contract Price in the Tokyo South submarket was 76, remaining steady from the previous quarter (4Q/FY 2023) at its lowest level since data collection began in 1Q/FY 2017. The Index of the Average Gross Yield on the Initial Asking Price also remained unchanged QoQ at 83.
In addition, while the number of transactions contracted has decreased from the previous quarter, when it rose sharply, it remains up YoY as favorable transaction conditions continue despite high price levels.
Such factors as the historically low yen and BoJ rate-hike policies intended to rectify associated inflation risks spurred a sharp rise in the yen and a decrease in stock prices, and both have been fluctuating widely since. Since real estate prices tend to lag somewhat behind stock prices, future financial market trends will need to be monitored closely. But even if they have been corrected from their peaks, the yen and interest rates both remain low while construction costs continue to rise. As such, the market is expected to remain stable for some time.
While favorable conditions continue in the real estate market in the Tokyo South submarket, there is a need to ascertain whether it will rise again or move in the opposite direction in the next period.
Pick Up Area -Tokyo North / West submarket-
(*) Tokyo North / West submarket: Suginami-ku, Nakano-ku, Nerima-ku, Toshima-ku, Itabashi-ku, Kita-ku, and Taito-ku
◆Movements by Quarter: Average Gross Yield on Contract Price / Average Gross Yield on Initial Asking Price / Number of Transactions
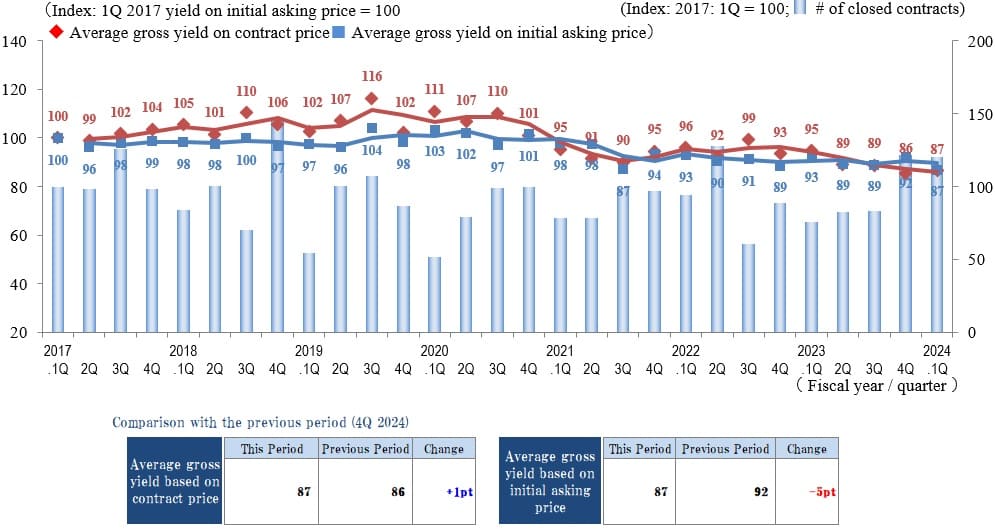
◆Brokered Transactions of Investment Real Estate in the Submarket
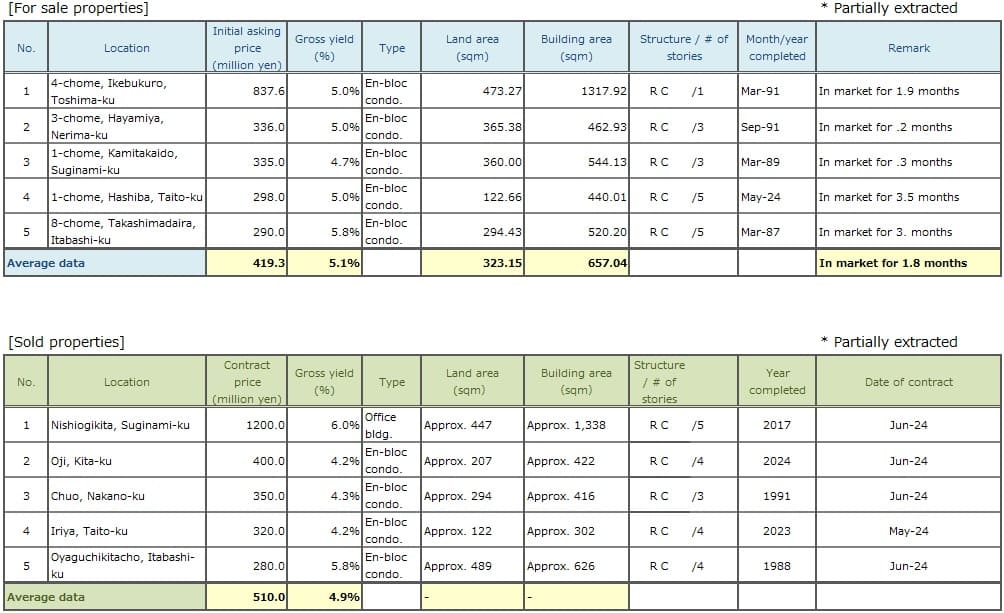
The Indices of the Average Gross Yields on the Contract Price and the Initial Asking Price in 1Q/FY 2024 here were up 1 pt (prices fell) and down 5 pt (prices rose), respectively, QoQ. The difference between these two yields was 0 pt, as market conditions appear to remain near equilibrium between demand and supply.
The number of transactions contracted also remains at a high level from last quarter, as real-estate investment market conditions in this submarket appear to be favorable. Despite these favorable market conditions, construction costs remain high, and cases have appeared of revising new projects or delaying construction.
In light of high renovation costs, businesses are increasingly considering selling off existing properties as well, and this could lead to a change in the balance between demand and supply, which currently is at equilibrium. Since there are numerous issues that could affect the real estate investment market aside from construction costs, such as exchange-rate and stock market trends and the BoJ decision to raise policy interest rates, future market trends will need to be monitored closely.
Pick Up Area -Tokyo East submarket-
(*) Tokyo East submarket: Koto-ku, Sumida-ku, Arakawa-ku, Edogawa-Ku, Katsushika-ku, and Adachi-ku
◆Movements by Quarter: Average Gross Yield on Contract Price / Average Gross Yield on Initial Asking Price / Number of Transactions
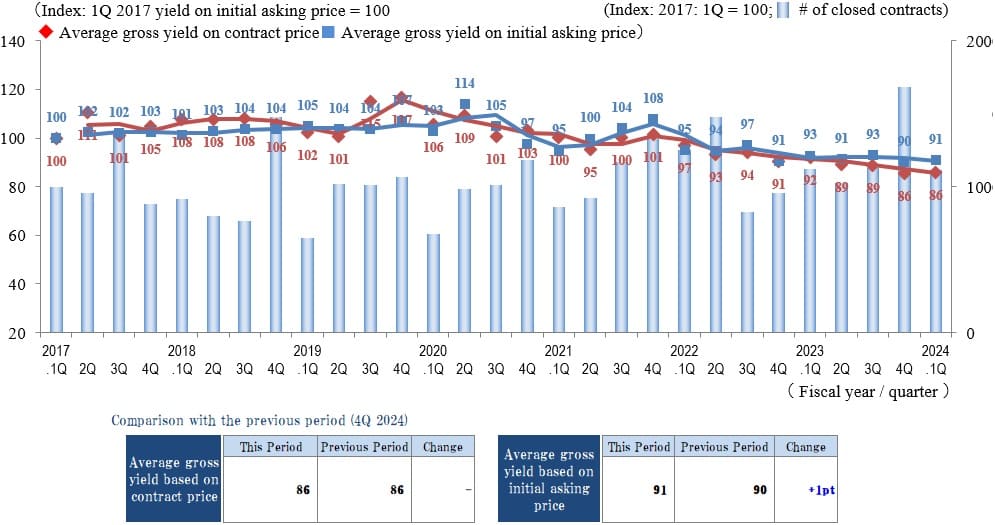
◆Brokered Transactions of Investment Real Estate in the Submarket
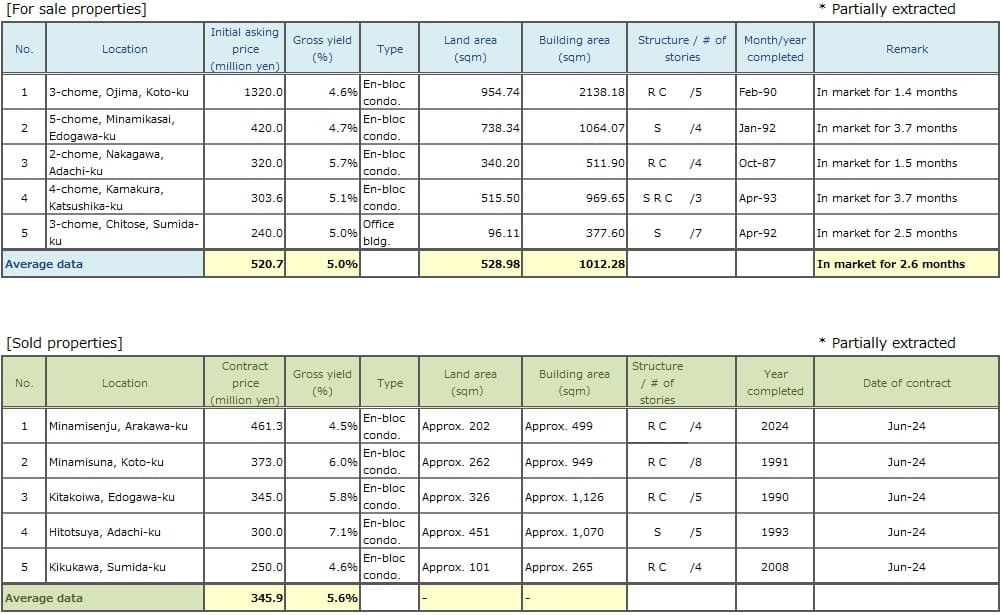
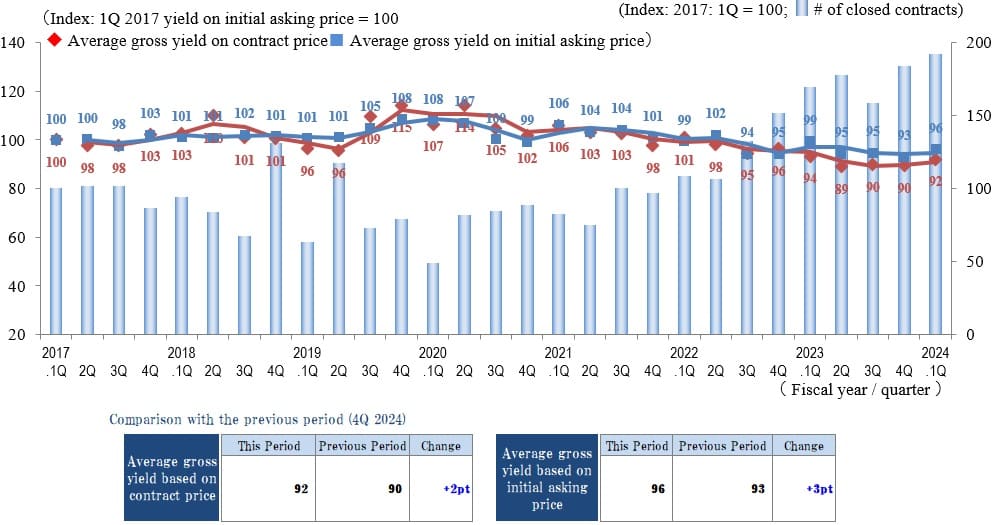
In the Tokyo East submarket, both the Index of the Average Gross Yield on the Contract Price and the Index of the Average Gross Yield on the Initial Asking Price remained largely unchanged in 1Q/FY 2024, as favorable market conditions continue.
While a look at market conditions over the most recent year shows various factors contributing to volatility, such as domestic and overseas interest rate trends and substantial increases in construction and building-material costs, there are no signs at present of sudden fluctuations in prices or yields. Still, the Index of the Average Gross Yield on the Contract Price shows a gentle decreasing trend (prices are rising). However, in light of these conditions market polarization seems to be advancing further between those intending to continue active investments and those adopting a wait-and-see attitude.
While the market environment can be said to remain favorable, each of the steps in the series of activities of purchase, holding and managing, and finally sale of real estate for investment or business use seems to have become more difficult compared to last few years. One event likely to affect the future outlook is the July 31 decision by the BoJ's monetary policy meeting to raise the policy interest rate to about 0.25%. It would be advisable to pay close attention to the kind of impact that this and other events, such as global drops in stock markets in August, have on real estate market conditions and the mindsets of investors and businesses.
Pick Up Area -Yokohama / Kawasaki region-
(*) Yokohama and Kawasaki region: Yokohama city, Kawasaki city
◆Movements by Quarter: Average Gross Yield on Contract Price / Average Gross Yield on Initial Asking Price / Number of Transactions
◆Brokered Transactions of Investment Real Estate in the Submarket
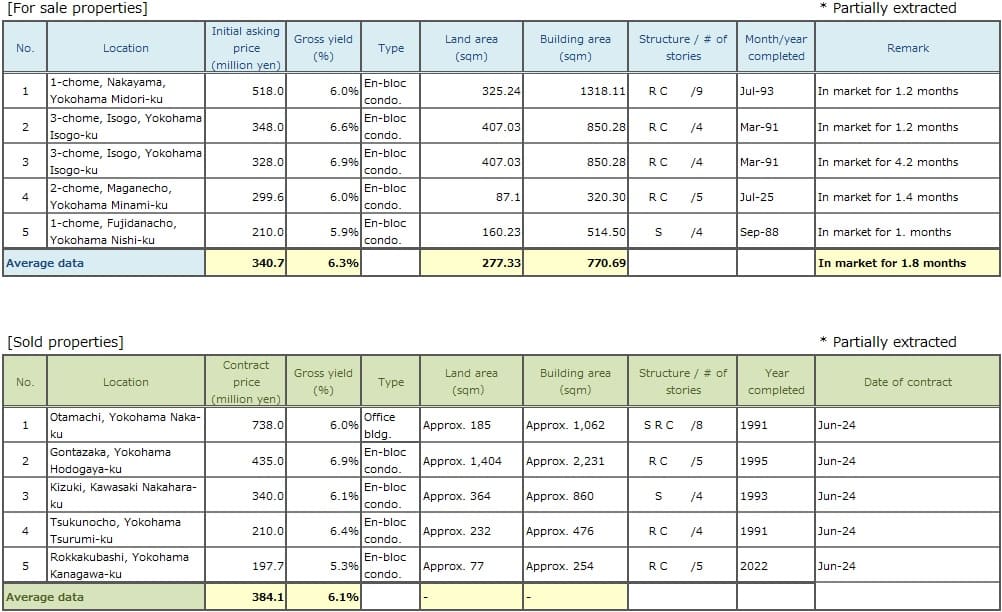
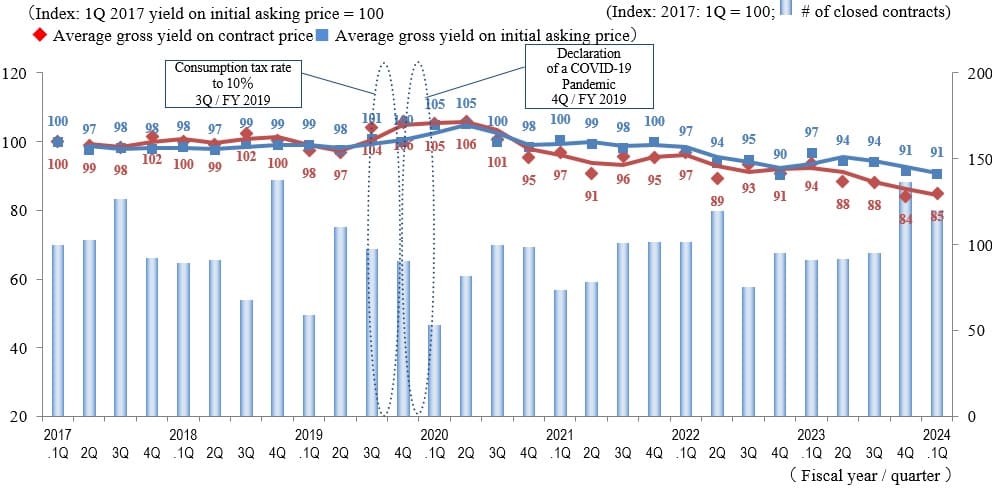
The number of transactions contracted in the Yokohama/Kawasaki region in 1Q/FY 2024 was up sharply both QoQ and YoY as brisk market conditions appear to continue. At the same time, while a look at average yields shows no major changes, yields were up QoQ (transaction prices fell) for both contract and asking prices. While these merely represent averages and do not mean that the possibility of price drops has risen, it is a fact that even though the number of transactions contracted itself is increasing, considerable gaps are apparent in contracted yields depending on transaction conditions. The trend toward market polarization is becoming more pronounced because investors appear to have become more selective in the overheated real estate investment market.
At the same time, construction costs continue to rise for demolition, new construction, and renovations, and in increasing numbers of cases, they are putting pressure on land prices in transactions for development sites. The impact of this trend is particularly large in suburban areas where land prices are lower than in central Tokyo. Uncertainty appears to continue in prices of commercial sites.
As the change in monetary policy means a world of positive interest rates is becoming a reality in Japan, it is anticipated that the increasing difficulty of raising funds in the future could have more than a minor impact on investment decisions on the buyer side. Also, as the upward trend in stock prices, which had continued in part because of exchange rate effects, has entered a phase of adjustment, uncertainty factors are expected to increase in the real estate investment market. Further close observation will be crucial.
General overview
◆Movements by Quarter: Average Gross Yield on Contract Price / Average Gross Yield on Initial Asking Price / Number of Transactions for the 5 Areas
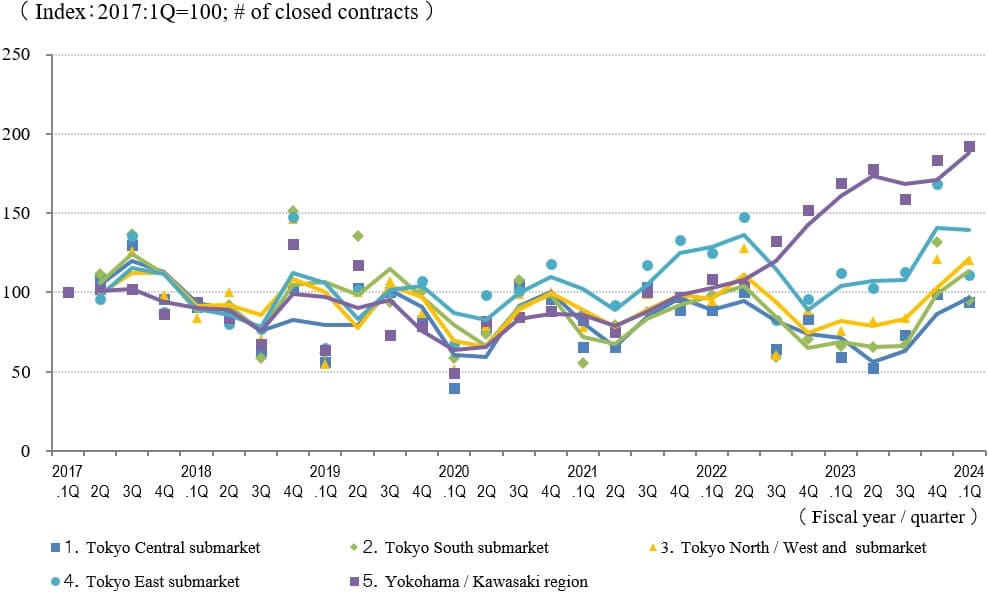
◆Movements in Number of Transactions by Area
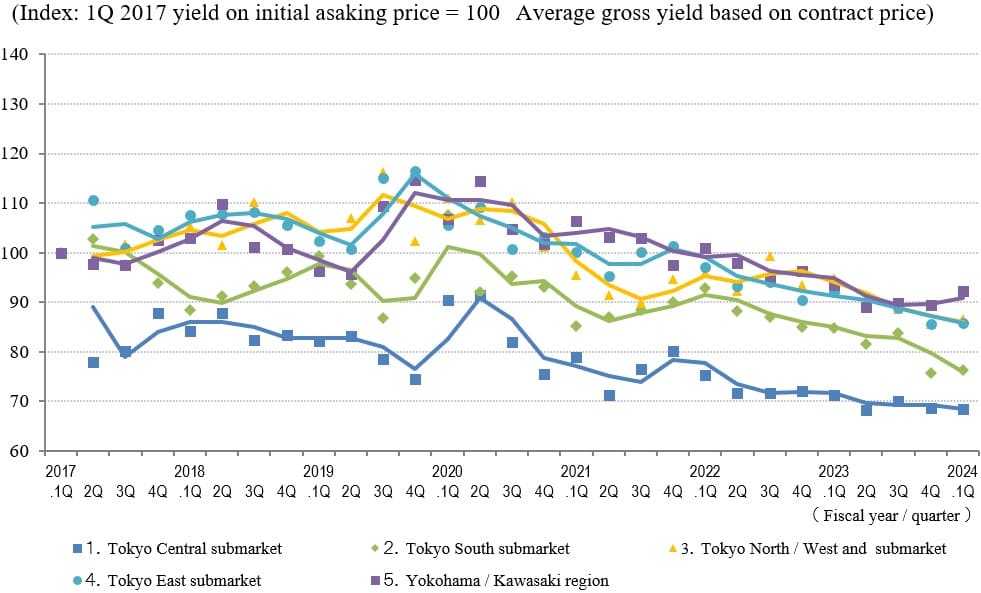
◆Movements in Average Gross Yield on Contract Price by Area
◆Movements in Average Gross Yield on Initial Asking Price by Area
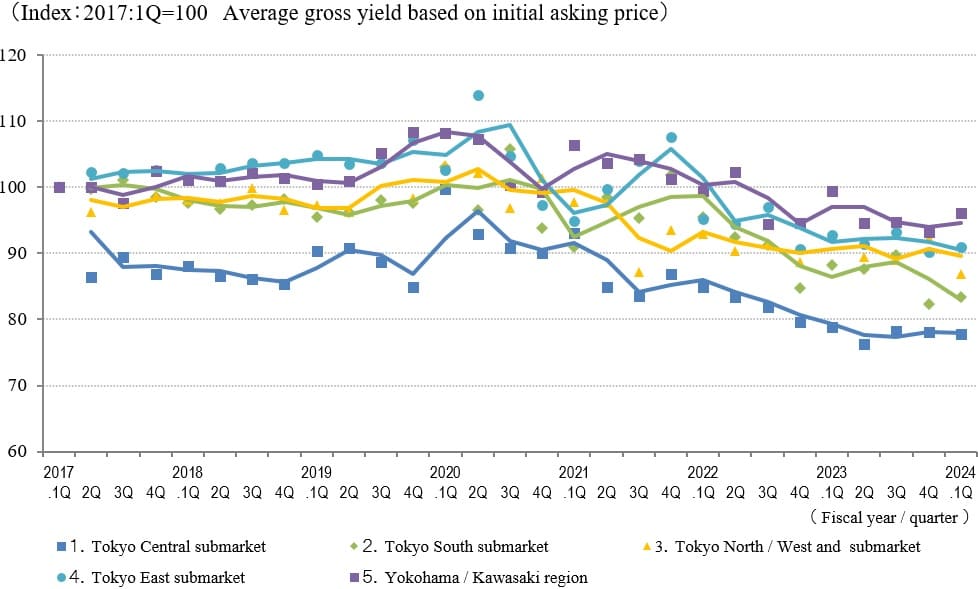
In 1Q/FY 2024 the Index of the Average Gross Yield on the Contract Price remained largely unchanged in the Tokyo Central, Tokyo South, and Tokyo East submarkets and increased in the Tokyo West and Tokyo North submarkets and the Yokohama/Kawasaki region. Across the area as a whole, it was up 1 pt QoQ while remaining at a low level. The Index of the Average Gross Yield on the Initial Asking Price remained largely unchanged in the Tokyo Central and Tokyo South submarkets, decreased in the Tokyo West and Tokyo North submarkets, and increased in the Tokyo East submarket and the Yokohama/Kawasaki region.
The number of transactions that contracted increased in the Yokohama/Kawasaki region, remained largely unchanged in the Tokyo West and Tokyo North submarkets, and decreased slightly in the Tokyo Central, Tokyo South, and Tokyo East submarkets. While submarkets that were down sharply QoQ stood out, levels remain high.
The change in monetary policy appears to have had a major impact on investors as seen, for example, in the Nikkei Average experiencing its largest drop ever in August. The extent of any aftereffects that this may have in the real estate investment market is attracting very high levels of attention.


