Our Site uses cookies to improve your experience on our website. For more details, please read our Cookie Policy.
By closing this message or starting to navigate on this website, you agree to our use of cookies.
Our Site uses cookies to improve your experience on our website. For more details, please read our Cookie Policy.
By closing this message or starting to navigate on this website, you agree to our use of cookies.
This page is translated using machine translation. Please note that the content may not be 100% accurate.


Contact
Mitsui Fudosan Realty can provide a wide range of real estate services on both investment and residential properties.
Please feel free to give us a call or contact with mail inquiry.
Phone(English Line)
Contact Information by Region
- China400-120-1319
- HongKong800-93-3060
- Taiwan00801-81-2728
- Japan(English)0120-923-431
- Other Regions+81-3-6758-4072
This page is translated using machine translation. Please note that the content may not be 100% accurate.

PROPERTY MARKET TRENDS | 3Q 2024
PROPERTY MARKET TRENDS | 3Q 2024
Growing inbound demand is revitalizing the real estate market overall
Hospitality: Although new hotels open successively, the supply continues to fall short of demand Shopping centers: Inbound consumption remains favorable despite deterioration of performance of GMS (General Merchandise Stores) J-REITs: Increasing investments by foreign investment funds
Residential
There is a pronounced decline in the transaction rate due to the rising prices of condominiums in the Tokyo metropolitan area, on the other hand the numbers of contracts on preowned condos increased and market prices for rental apartments raised.
■New condo. sales in Tokyo metropolitan area
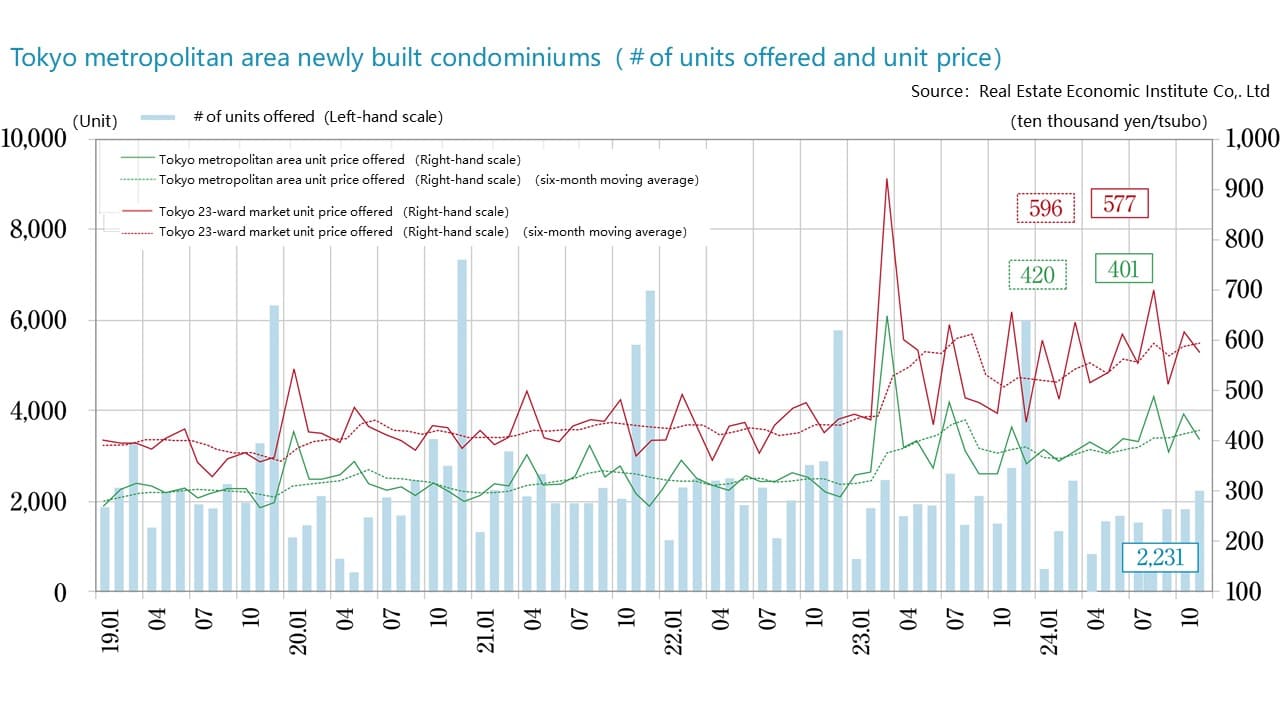
・In 2024, there was a new supply of 23,003 units (down 14.4% YoY) and an inventory of 6,814 units at the end of the year (up 531 YoY). The average initial sales price, floor area, and initial sales price per tsubo* were JPY 78.2 million (down 3.5% YoY), 66.42 sqm (up 0.5% YoY), and JPY 3.891 million per tsubo (down 0.4% YoY), respectively. The average price fell for the first time in six years and the average sales price per tsubo also fell for the first time in 12 years. The contract rate at the start of the month was 66.9% (down 3.4 ppt YoY), returning to the 60% level for the first time since 2020. (*Note: Tsubo is a Japanese traditional unit of area equal to approx. 3.31 sqm.)
・Looking at prices by area, the average property price in the 23 wards of Tokyo was 111.81 million yen (down 2.6% YoY), 58.9 million yen (up 8.9% YoY) in suburban Tokyo, 64.32 million yen (up 6.0% YoY) in Kanagawa Prefecture, 55.42 million yen (up 13.8% YoY) in Saitama Prefecture, and 56.89 million yen (up 18.9% YoY) in Chiba Prefecture. While the average property price fell slightly in the 23 wards of Tokyo, it rose in all other areas.
■New condo. sales in Kinki region
・In 2024, there was a new supply of 15,137 units (down 1.6% YoY) and an inventory of 3,050 units at the end of the year (down 411 YoY). The average initial sales price, floor area, and initial sales price per tsubo were JPY 53.57 million (up 14.8% YoY), 59.10 sqm (up 0.1% YoY), and JPY 2.998 million per tsubo (up 14.8% YoY), respectively. The contract rate at the start of the month was 74.3% (up 2.9 ppt YoY), remaining at 70% or higher for the third consecutive year.
・Looking at prices by area, the average property price was 61.26 million yen (up 45.7% YoY) in the city of Osaka, 48.27 million yen (down 2.4% YoY) in Osaka Prefecture, 46.05 million yen (down 7.1% YoY) in the city of Kobe, and 56.1 million yen (down 1.9% YoY) in the city of Kyoto. The sharp increase in the city of Osaka stands out.
■Second-hand condo. sales in Tokyo metropolitan area (January 2025)
・The number of transactions concluded was 3,242 units (up 19.6% YoY), remaining up YoY for three consecutive months. The average age of these second-hand condos was 25.73 years.
・The average sold price was 51.47 million yen (up 5.9% YoY), the average floor area was 62.86 sqm (down 1.7% YoY), and the average sold price per tsubo was 2.707 million yen (up 7.8% YoY). Even as the average floor area decreased, the average sold price remained up YoY for the 57th consecutive month.
・The numbers of listings in inventory and newly listed were 45,478 (down 4.2% YoY) and 15,459 units (down 6.5% YoY), respectively. Inventory was down YoY for the ninth consecutive month.
・YoY comparison of the number of transactions by area shows growth of 17.8% in the 23 wards of Tokyo, 15.0% in suburban Tokyo, 23.8% in Kanagawa Prefecture, 21.8% in Saitama Prefecture, and 20.0% in Chiba Prefecture.
■Rental apartments in Tokyo metropolitan area
・The number of transactions for rental apartments in Tokyo metropolitan area was 31,370 (up 2.4% YoY) in October-December 2024. The share of the 23 wards of Tokyo was 61.7%.
・Looking at prices by area, the average monthly rent (YoY comparison) were 115,000 yen (up 0.6% YoY) in the 23 wards of Tokyo, 79,000 yen (up 2.6% YoY) in suburban Tokyo, 90,000 yen (up 5.9% YoY) in Yokohama and Kawasaki, 80,000 yen (up 5.3% YoY) in Saitama Prefecture, 80,000 yen (up 6.7% YoY) in Chiba Prefecture, and 74,000 yen (up 8.8% YoY) in Kanagawa Prefecture, as rents rose in all areas.
・As condominium prices for sale are rising in the 23 wards of Tokyo, the number of renters is growing and a shortage of rental apartments continues, causing the demand to spread to the surrounding areas.
■Market overview
・The market for new condominiums in Tokyo metropolitan area showed a new supply of only 23,000 units in 2024 as the market contracts. As the new supply in the 23 wards of Tokyo decreases, average prices have been falling, but a look at results by area shows that prices continue to rise in numerous areas. Price adjustments are difficult as construction costs remain high, and it is thought that conditions will continue under which purchase of condominiums by primary buyers is difficult.
・The market for new condominiums in the Kinki region has shown an annual supply of 15,000–19,000 units since 2019. The contraction of supply in the central area of the city of Osaka is pronounced. Price adjustments are apparent outside of the city of Osaka. Contract conditions are favorable, and the market appears to be responding to high construction costs by decreasing exclusive floor areas.
・The second-hand condo market showed an increase in the number of contracts, despite a decrease in the number of units as the supply of new condos decreased and their prices rose. While prices are rising overall, there are differences in popularity by area.
・The Tokyo 23 wards account for about 60% of the rental apartment market in the Tokyo metropolitan area in which contracts were made on about 10,000 units per month. Tenants tend to prefer central locations convenient for commuting and living. Due to the increase in apartment prices for sale and the chronic shortage for rental apartment, the numbers of people who choose to rent is increasing, chiefly among the young.
Office
Market conditions are favorable as the impact of COVID-19 appears to have largely disappeared. The filling vacancies in the large-scale new supply in 2025 will determine future market conditions.
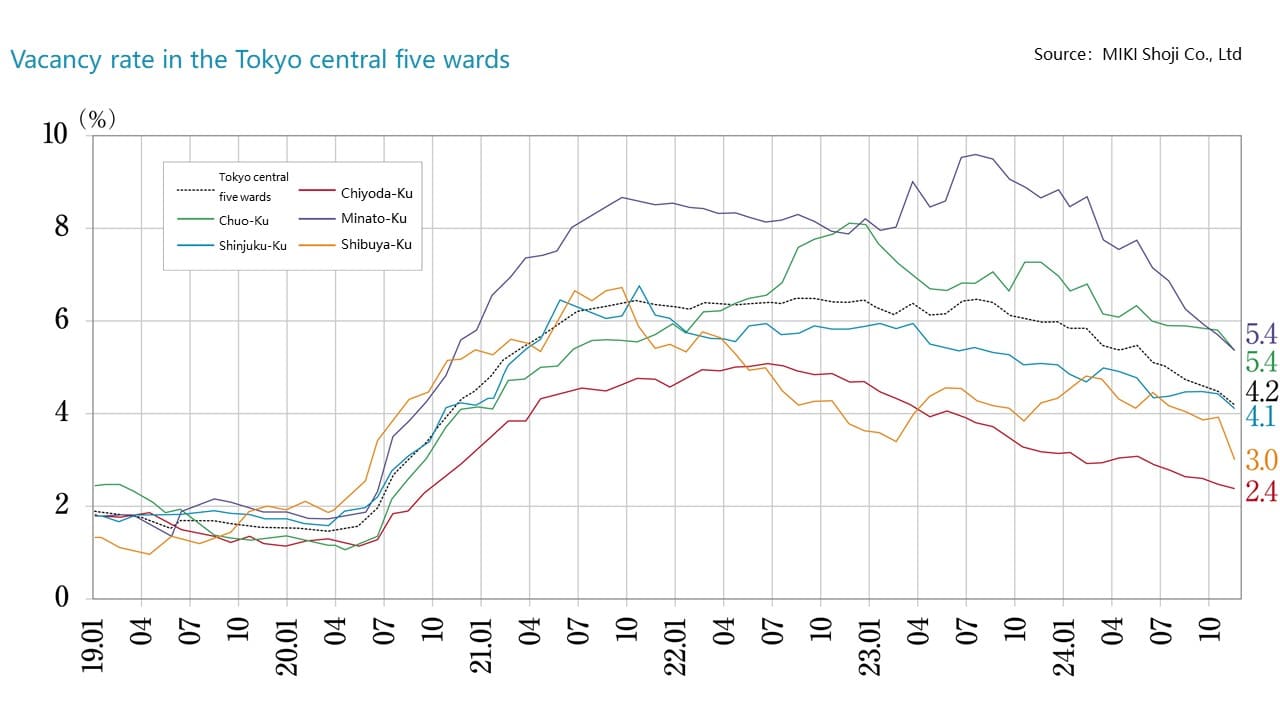
■Large-scale office buildings in Tokyo CBD (Central 5 wards)
・As of January 2025, the vacancy rate was 3.83%, down 0.17 ppt MoM and remaining below 5% since August 2024. Filling of vacancies continues this month with a vacancy rate remaining at the 3% level.
・Average rent was JPY 20,368 per tsubo, up JPY 72 MoM and up JPY 638 YoY, as rent has remained above JPY 20,000 per tsubo since July 2024 and continues to rise.
・Total leased floor area was 8,021,814 tsubo, up 6,448 tsubo YoY as eight new office buildings came on the market.
・Vacancy rates are falling (recovering) in all five central wards with rates in the Chiyoda and Shibuya wards both below 3%. Rent shows an increasing trend in the four wards other than Chuo ward. Rent rose sharply by JPY 456 MoM in Shibuya ward where floor area for lease is scarce.
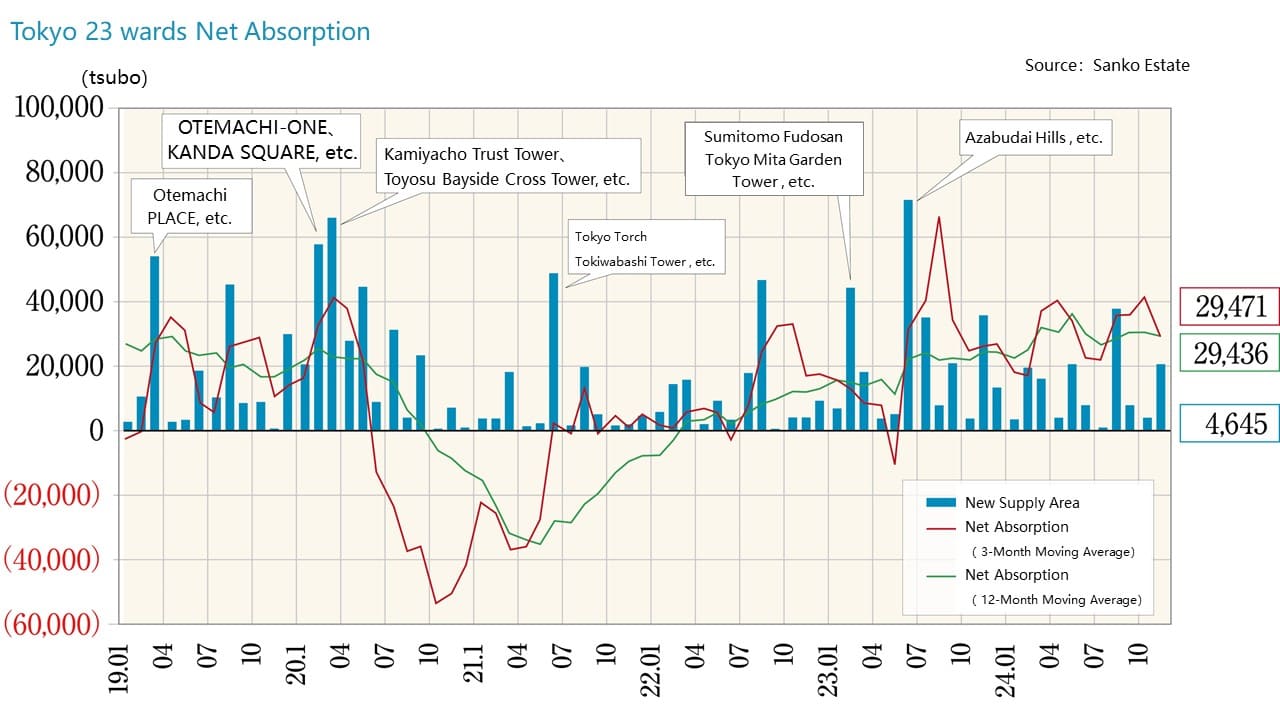
■Net absorption
・Single-month net absorption (change in office occupied floor space) of the 23 wards of Tokyo in January was +16,556 tsubo, remaining positive for the seventh consecutive month and up sharply from -3,183 tsubo YoY.
・The vacancy rate on new buildings (completed less than one year ago) is 29.0%. The rate was 30.2% in the same month last year. While improving, it still remains high.
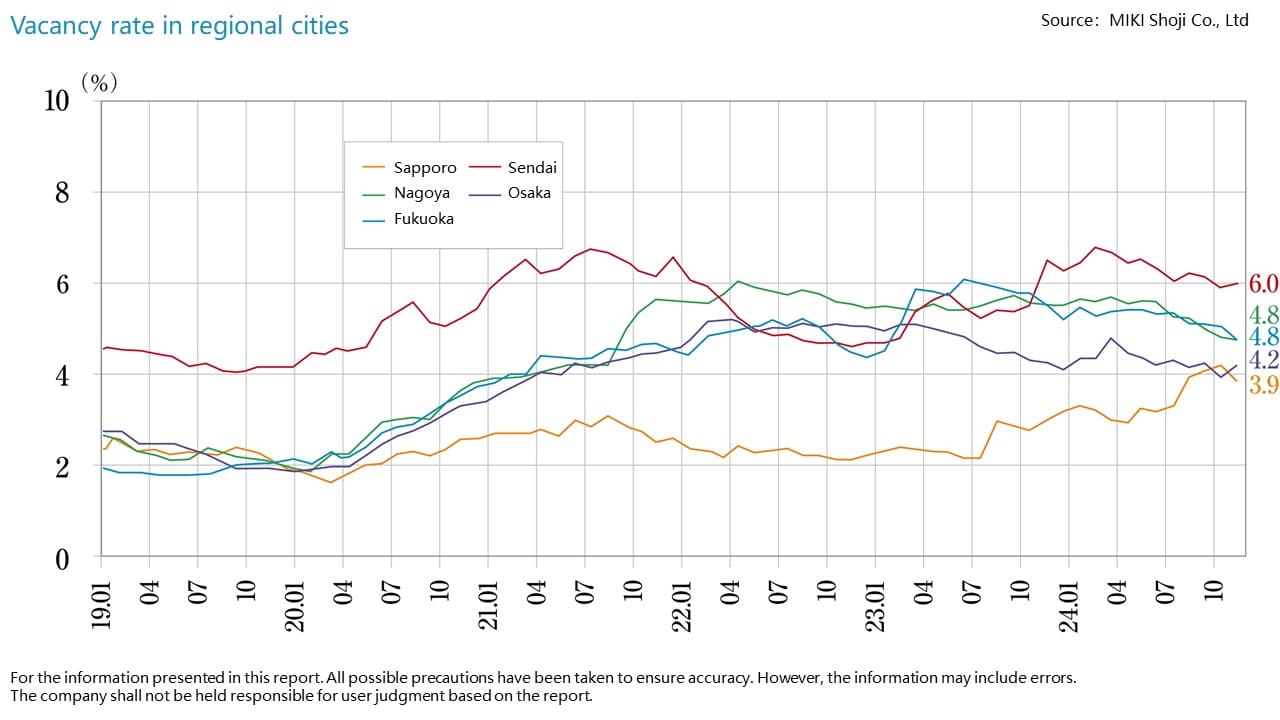
■Vacancy rates, and movements in average rents in major regional cities / January 2025
・Sapporo: Vacancy @ 3.82% up 0.12 ppt MoM. Average rent @ JPY 10,717 per tsubo up JPY +28 MoM. (Vacancy rate increased slightly, while average rent improved.)
・Sendai: Vacancy @ 5.89% down 0.02 ppt MoM. Average rent @ JPY 9,406 per tsubo up JPY +13 MoM. (Vacancy rate changed little, while average rent improved.)
・Yokohama: Vacancy @ 6.85% down 0.49 ppt MoM. Average rent @ JPY 12,919 per tsubo up JPY +1 MoM. (Vacancy rate improved, while average rent changed little.)
・Nagoya: Vacancy @ 4.41% down 0.13 ppt MoM. Average rent @ JPY 12,581 per tsubo up JPY -3 MoM. (Vacancy rate improved slightly, while average rent changed little.)
・Osaka: Vacancy @ 4.04% changed 0 ppt MoM. Average rent @ JPY 12,217 per tsubo up JPY +47 MoM. (Vacancy rate changed little, while average rent improved.)
・Fukuoka: Vacancy @ 5.24% down 0.32 ppt MoM. Average rent @ JPY 11,878 per tsubo up JPY +7 MoM. (Vacancy rate and average rent improved.)
The vacancy rate increased in Sapporo. Vacancy rates fell in Sendai, Yokohama, Nagoya, and Fukuoka. The rate remained largely unchanged in Osaka. Occupancy improved in Yokohama and Fukuoka. While rents were up sharply in Sapporo and Osaka, the other four areas showed only minor change as the market appears to have entered a stable phase.
■ Status quo and future market outlook
・Average rents continue to increase in most areas as favorable conditions continue. At the same time, high rent levels on new large-scale office buildings, for which new supply has been large in recent years, mean it takes time to secure tenants. The market has entered the post-COVID phase, and contracts are being concluded successively. Still, tough conditions are likely to continue for a while in light of the large volume of new buildings added to the supply in recent years.
・Demand continues for more comfortable office spaces, such as those with free address designs, but some drawbacks of free address offices have become apparent. In increasing cases, employers are returning to assigned desks for all workers since tenants have begun choosing more diverse layouts.
・According to Sanko Estate, new supply of medium-sized office buildings (50 or more tsubo/floor) in 2025-2027 was approx. 441,000 tsubo in the five central wards of Tokyo, 40,000 tsubo in the three main wards of Osaka, 33,000 tsubo in Sapporo, 5,000 tsubo in Sendai, 46,000 tsubo in Nagoya, and 49,000 tsubo in Fukuoka. New supply in the 23 wards of Tokyo exceeded 540,000 tsubo in 2022–2024, and conditions of oversupply are expected to continue in the future. Attention is focusing on the extent to which new buildings can capture demand.
Hospitality
Growth in the number of guests from Europe is pronounced. For example, in some areas, guests from overseas outnumber those from Japan. The number of guests on long-term stays is increasing, too.
■Inbound travelers continue to increase in number
・In December 2024, the total number of overnight stays in Japan was 54.61 million (up 6.3% YoY). Of these, 15.41 million were from abroad (up 22.9% YoY), and 39.2 million were Japanese (down 1.9% YoY).
・A look at numbers of overnight stays (57.117 million) by type of facility in November 2024 shows figures of 6.267 million for resort hotels (down 5.3% YoY), 27.797 million for limited-service hotels (up 3.2%), 8.898 million for full-service hotels (down 7.5%), and 7.449 million for Japanese inns (up 0.7%). YoY comparison limited to guests from overseas alone shows increasing demand in all categories with overnight stays up 13.2% for resort hotels, 24.8% for limited-service hotels, 1.7% for full-service hotels, and 11.7% for Japanese inns.
■Inbound trends
・Total overnight stays by nationality (at facilities with 10 or more employees) in November 2024 show that the top nationalities of guests from abroad were Chinese (1.912 million), Taiwanese (1.509 million), American (1.467 million), and South Korean (1.402 million). Nationalities showing high rates of increase (YoY) were Russian at 113.1%, Spanish at 90.1%, Chinese at 69.3%, and Italian at 60.9%, while partly due to seasonal factors, those showing sluggish rates of increase (YoY) are of Southeast Asian countries.
・Inbound tourist demand is weighted heavily toward Japanese culture and other experiences. Demand for destinations among inbound travelers appears to be broadening as the travelers who came first to experience what they could in urban areas increasingly seek more authentic (rural) experiences on return visits.
■Status quo and future market outlook
・In response to growing numbers of inbound guests, in 2024 Hilton, the Marriott Group, the Accor Group, Hoshino Resorts, and other hotel operators opened new or rebranded hotels. New hotels are planned to open in various locations in 2025 as well with not only high-end brands but also lower-end hotels, such as Route Inn, Toyoko Inn, and APA Hotels & Resorts opening numerous new facilities as the market is projected to grow.

Commercial
Inbound consumption is contributing to overall shopping center sales, while regional shipping centers catering to leisure demand also show favorable performance.
■Sales volume and status quo of shopping centers
・Existing store sales for shopping centers (overall) were approximately JPY 32.1254 trillion (up +5.8% YoY) in 2024 as favorable conditions continued. Sales of key tenants grew by 3.7% and those of other tenants by 6.4% YoY. Viewed by region, sales were up YoY in both urban and provisional areas with the cities of Osaka and Kobe seeing increases of 10% or more.
・According to the Japan Department Store Association, sales in January 2025 remained strong at JPY 480.5 billion (up 5.2% YoY). Inbound sales were up for the 34th consecutive month to JPY 61.9 billion (up 54.9% YoY), driven by the low yen and the lunar New Year holidays.
■Future market outlook
・The restructuring of Ito Yokado to Seven & I Holdings was completed ahead of schedule, and as a number of loss-making GMS stores were closed, their number fell to 92 stores in February 2025 of which 49 were centered in Tokyo and Kanagawa Prefecture for better management. Among the remaining stores, in some cases Ito Yokado remains as the core tenant of the Ario shopping centers as it appears to be accelerating its transition to a grocery supermarket.
・Thirty-eight shopping centers were newly opened in 2024. Of these, 13 had shop floor areas of 10,000 sqm or more, including outlet malls and home improvement centers as well as attention-getting facilities, such as Nagasaki Stadium City and Shibuya Sakura Stage.
・A survey of inbound consumption trends announced by the Japan Tourism Agency shows record high consumption by visitors from abroad in 2024 at approx. JPY 8.1 trillion. Average spending on shopping per person was JPY 66,000 with Chinese tourists spending the most by nationality.

Logistics
As a new supply is projected to decrease in the Tokyo metropolitan area, the vacancy rate is expected to fall. Despite the projected large-scale new supply in the Kinki, Chubu, and Fukuoka areas, demand also remains strong.
■2024 4Q market conditions in the Tokyo metropolitan area and conditions by area
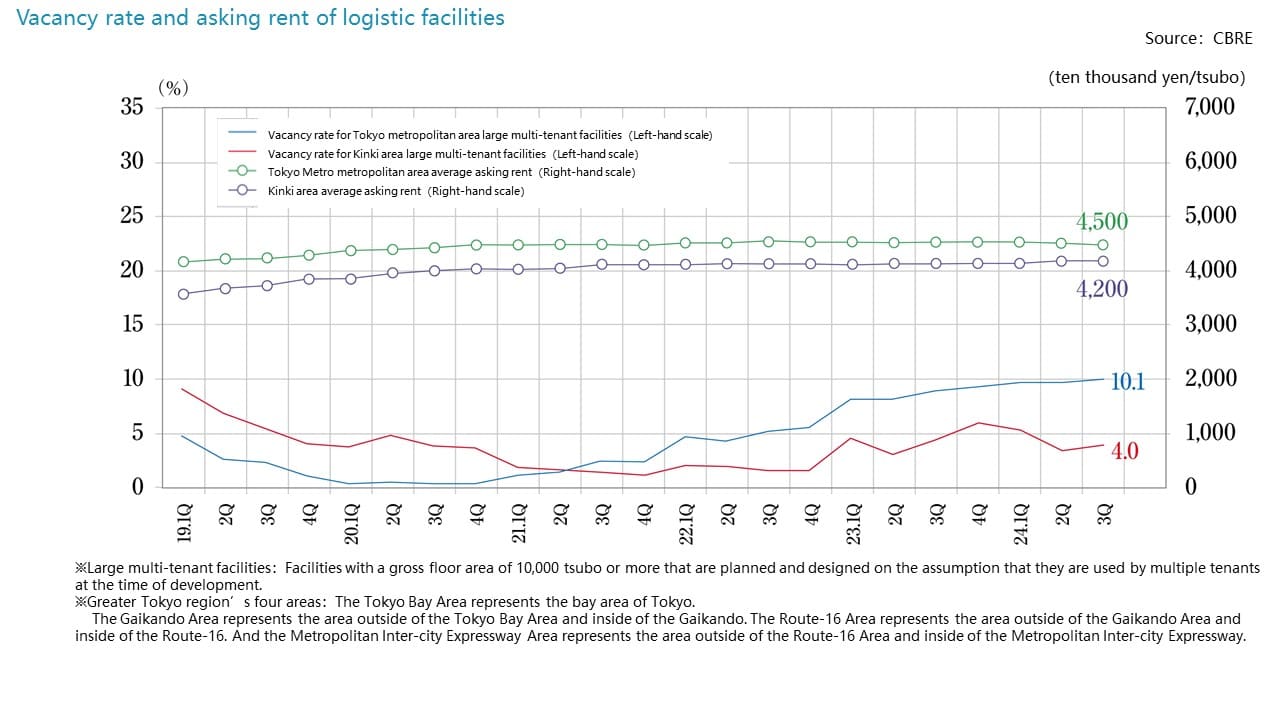
・In the Tokyo Bay area, the vacancy rate was 9.7% (down 2.7 ppt YoY) and rent was JPY 7,590 per tsubo (up 0.1%). As the filling of vacancies continues, the roughly year-long downward trend in rents is easing.
・In the Tokyo Gaikan Expressway area, the vacancy rate was 6.6% (down 0.8 ppt YoY), and rent was JPY 5,260 per tsubo (flat). Filling of vacancies continues chiefly among existing properties, and practical inquiries are being received for properties planned for completion because demand is strong. The trend in rents should be monitored, since there are multiple cases apparent of relatively newer facilities with large vacancies.
・In the National Route 16 area, the vacancy rate was 8.8% (flat), and rent was JPY 4,520 per tsubo (flat). Two new facilities were added to supply, one of which opened to full occupancy upon completion, while filling of vacancies continues at existing properties. Vacancies increased slightly in Kanagawa Prefecture, and there were examples of both new contractors and cancellations. A new supply in 2025 is projected to be 203,000 tsubo. Since new demand in the full year 2024 was 255,000 tsubo, the vacancy rate is expected to decrease.
・In the Metropolitan Intercity Expressway area, the vacancy rate was 14.8% (down 0.6 ppt YoY), and rent was JPY 3,550 per tsubo (down 0.3 % YoY). One new facility was completed in Saitama Prefecture with considerable vacancies remaining, but the continued filling of vacancies at existing facilities in Chiba and Ibaraki helped to avoid a sharp downturn. Eight new facilities (238,000 tsubo) are planned to be added to the supply in 2025, and the vacancy rate is expected to rise. A bearish market in Saitama Prefecture contributed to the downturn.
■Market condition in other regions
・In the Kinki region, the vacancy rate was 3.7% (down 0.3 ppt YoY), and the effective rent was JPY 4,210 per tsubo (up 0.2%). The new supply in the full year 2024 was just 192,000 tsubo, vs. new demand of 229,00 tsubo as vacancies remained low. Half of the properties completed in 2023 continue to have vacancies, and future trends will need to be monitored closely. The new supply planned for 2025 is 410,000 tsubo—the highest level on record. Leasing conditions are favorable for properties planned for future completion, and high-spec properties in the central areas are driving market rents up.
・Chubu region: The vacancy rate was 13.4% (down 0.4 ppt YoY), and the effective rent was JPY 3,670 per tsubo (up 0.3% YoY). While the one new building completed had vacancies remaining, vacancies are being filled in existing properties, resulting in a decrease in the vacancy rate. While large-scale new supply of 197,000 tsubo in eight properties is planned for 2025, preleasing conditions are favorable, and vacancies are expected to be filled. Rents are also expected to rise along with a trend toward selectivity regarding location and product.
・Fukuoka region: The vacancy rate was 5.1% (down 0.3 ppt YoY), and the effective rent was JPY 3,540 per tsubo (up 1.1% YoY). No new buildings were completed, and existing vacancies are being filled. Full-year new demand in 2024 reached a record high of 97,000 tsubo, and since a new supply of 51,000 tsubo is planned in 2025, the vacancy rate is in a decreasing trend. Rents show a strong increasing trend, and there are almost no vacancies in the vicinity of the city of Fukuoka.
■Future market outlook
・The new supply of space projected in 2025 is approximately 450,000 tsubo in the Tokyo metropolitan area, 400,000 tsubo in the Kinki region, 200,000 tsubo in the Chubu region, and 50,000 tsubo in the Fukuoka region, respectively.
・ The considerable new supply has continued in the Tokyo metropolitan area as six quarters during the past two years saw a new supply of 150,000 tsubo or more. Since vacancies are decreasing and rent levels rising centered on the bay area, the market can be expected to settle at a favorable balance in the second half of 2025.
・Continued demand is apparent for merchandise storage and e-commerce logistics in the Kinki region, and tentative leases have been concluded on about 70% of the new supply in 2025. As such, it is unlikely that the vacancy rate will increase sharply.
・Demand remains high compared to the planned new supply in 2025 in the Chubu and Fukuoka regions as well, and it is unlikely that their vacancy rates will increase sharply.
・Occupancy is expected to remain high in other markets (Sapporo, Sendai, Okayama, and Hiroshima) as well because of stable demand and low levels of the new supply.
J-Reit
Political changes in Japan and the United States are driving the index down, while investment by foreign investment funds increases.
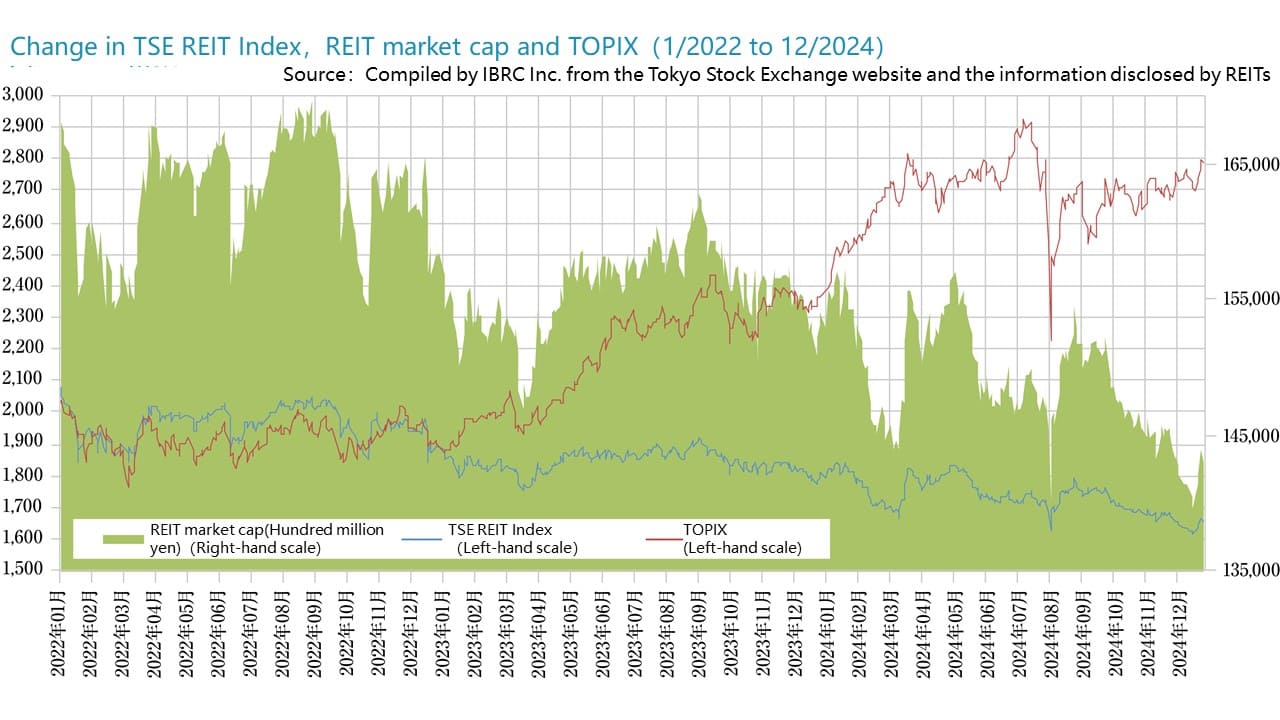
■J-Reit market trend
・As of the end of 4Q 2024 (October–December), the Tokyo Stock Exchange Reit Index closed at 1,652.94, down 4.25% from the end of 3Q (July–September). The aggregate total J-REIT market capitalization was JPY 14.2949 trillion, down 4.19% over the same period. This was in marked contrast to the bullish stock market where the TOPIX rose by 5.25% during the same period. The fourth quarter was a time of political changes in Japan and the United States. Regarding the monetary policy, the US Fed lowered interest rates in three consecutive meetings, and while interest rates in Japan have not risen, there are strong expectations that they will rise. Expectations of future interest rates are a factor driving the TSE REIT Index down.
・The aggregate AUM of J-REITs grew by JPY 149.6 billion from the previous period to JPY 23.6253 trillion as of the end of 4Q. While AUM for office J-REITs was down JPY 54.9 billion, it was up JPY 70.5 billion for logistics J-REITs and JPY 43 billion for hotel J-REITs.
・Backed by a lengthy downturn in the market prices of investment units, only 1 J-REIT (Nippon Hotel & Residential Investment Corporation) conducted a PO in 4Q, down sharply from 7 POs in 3Q. At the same time, the number of J-REITs conducting buybacks of their own investment units doubled from 5 in 3Q to 10 in 4Q. By selling real estate holdings and using the funds to buyback or retire their own investment units and provide returns to investors, J-REITs are attempting to increase their capital efficiency and returns on capital and break out of the lengthy slump in investment units.
■Status quo
・There is an apparent trend toward capital participation by foreign investment fund J-REITs as sponsors. In a series of announcements, the effective sponsor of the GLP J-REIT has shifted from a Chinese investment firm to the US investment firm Ares Management Corporation. The Asian investment firm CapitaLand Investment Limited has participated in the Japan Hotel REIT as a main sponsor, and Samty Residential Investment Corporation's main sponsor Samty joined the group of the Asian investment firm Hillhouse Investment Management. By participating in J-REITs, foreign investment firms appear to be moving to encourage investment in Japanese real estate amid expectations of inflation.