Our Site uses cookies to improve your experience on our website. For more details, please read our Cookie Policy.
By closing this message or starting to navigate on this website, you agree to our use of cookies.
Our Site uses cookies to improve your experience on our website. For more details, please read our Cookie Policy.
By closing this message or starting to navigate on this website, you agree to our use of cookies.
This page is translated using machine translation. Please note that the content may not be 100% accurate.


Contact
Mitsui Fudosan Realty can provide a wide range of real estate services on both investment and residential properties.
Please feel free to give us a call or contact with mail inquiry.
Phone(English Line)
Contact Information by Region
- China400-120-1319
- HongKong800-93-3060
- Taiwan00801-81-2728
- Japan(English)0120-923-431
- Other Regions+81-3-6758-4072
This page is translated using machine translation. Please note that the content may not be 100% accurate.

Quarterly Report for Premium Condominiums in Tokyo | 2Q FY 2025

【Chart 1】
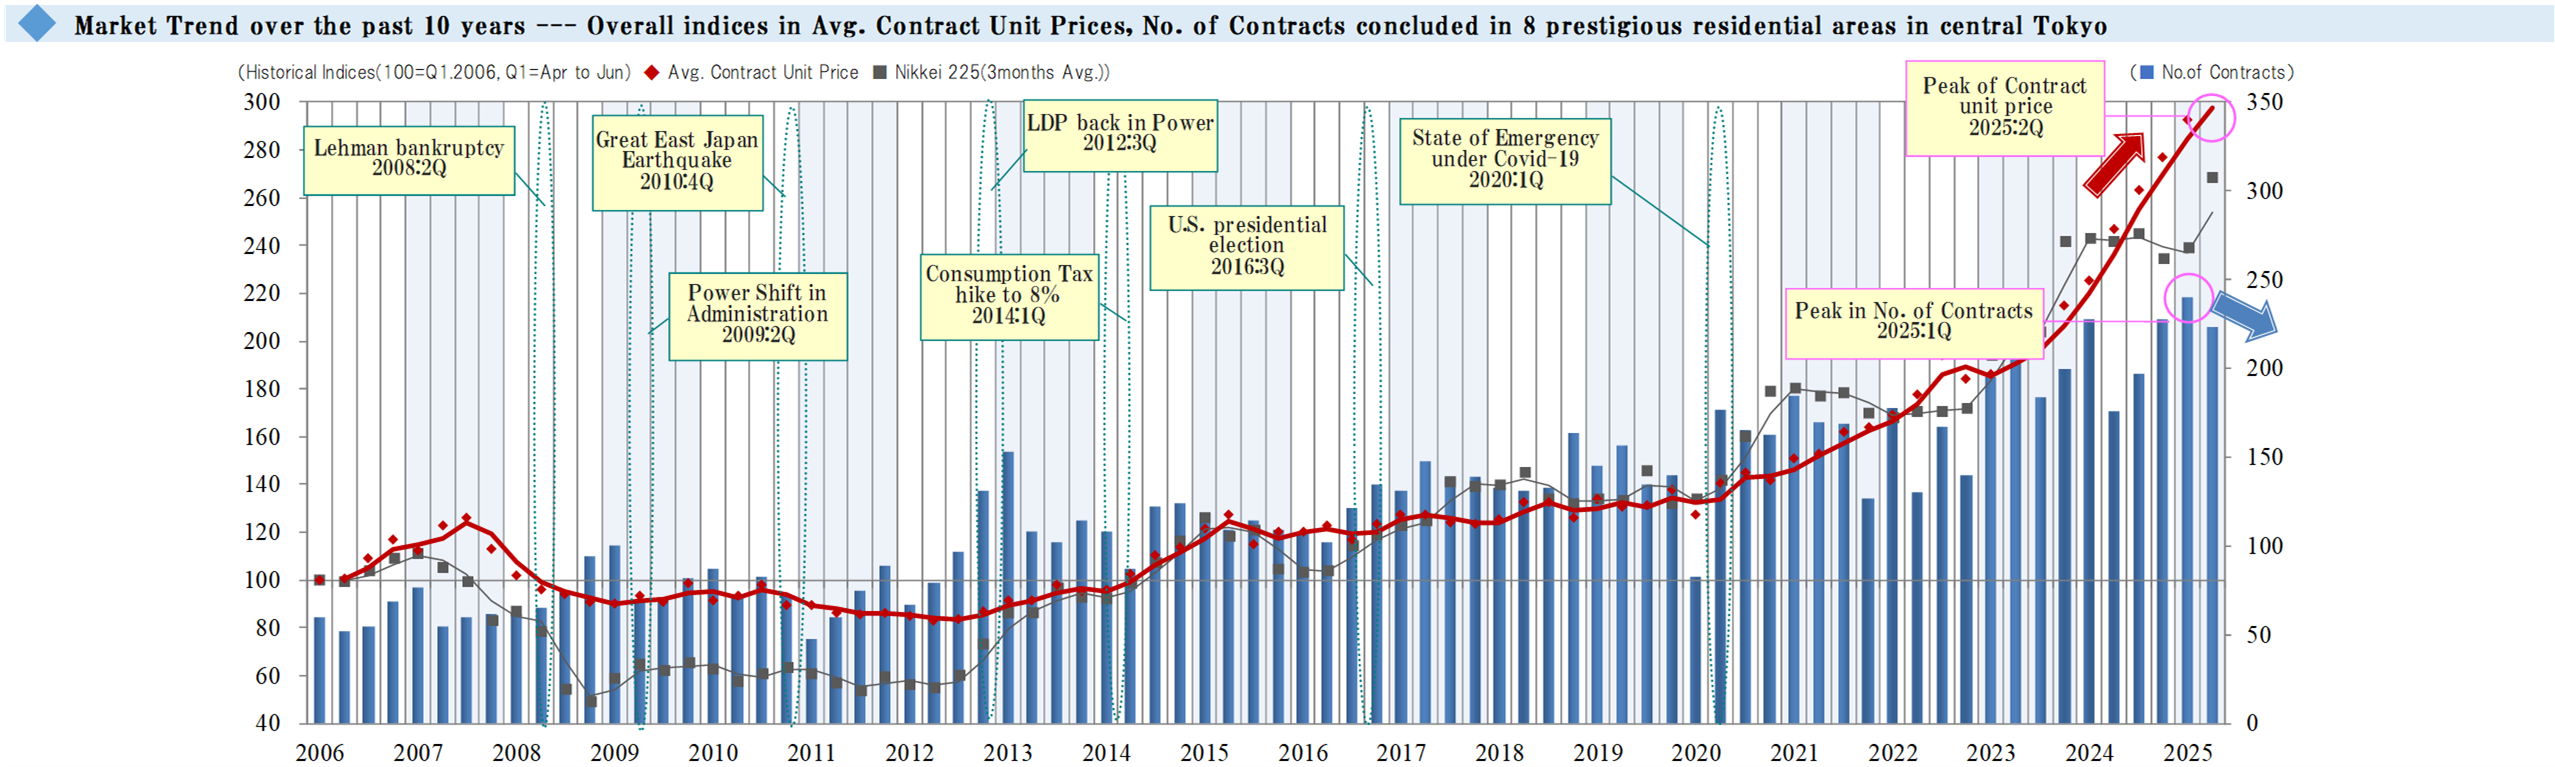
This graph shows an index of changes in average contract price per tsubo (*Notes: 1. Indexation using average contract price per tsubo in 1Q / FY 2006 as 100. 2. Tsubo is a Japanese traditional unit of area equal to approx. 3.31sqm.) and the number of contracts concluded every quarter for premium condo. units in 8 prestigious areas of central Tokyo.
Major economic events and Nikkei Stock Average are also shown for reference. The bar graph represents the number of contracts concluded each quarter. The red-line shows a movement in the index of average contract price per tsubo, while the gray-line shows one in the Nikkei stock average.
In the first quarter reviewed here (2025:2Q), the index of the average contract price per tsubo for premium condominium units sold overall rose by +10.7 points QoQ to 302.8, setting a new record since the beginning of data collection for the 9th consecutive quarter. At the same time, the number of contracts concluded fell by 17 QoQ to 223, decreasing for the first time in four quarters.
【Chart 2】
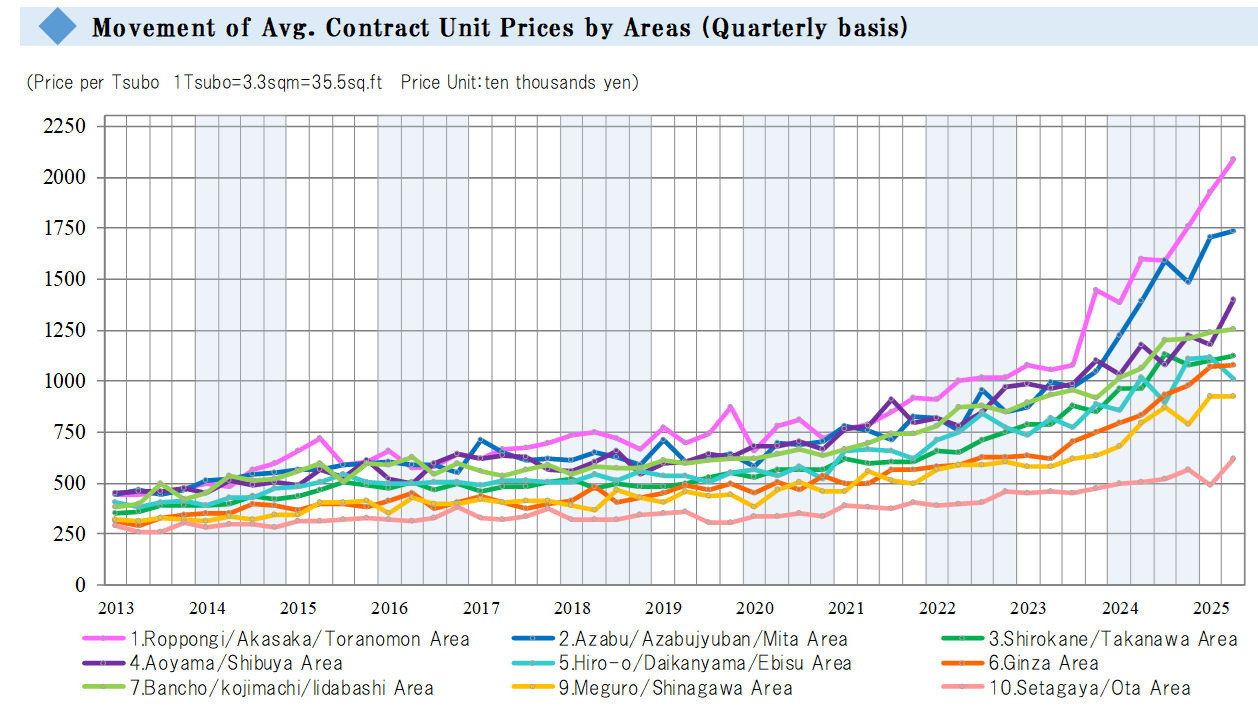
The chart above shows the trend in the average contract price per tsubo by area. There were increases in all 8 areas other than “Hiroo / Daikanyama / Ebisu Area” and “Ichigaya / Yotsuya Area,” where the average contract price per tsubo decreased this quarter. 7 of these areas went up to record historical highs since the beginning of data collection. Among these, “Ginza Area” reached a new record high for the 8th consecutive quarter, while “Bancho / Kojimachi / Iidabashi Area” and “Roppongi / Akasaka / Toranomon Area” did so for the 6th and 3rd consecutive quarters, respectively.
【Chart 3】
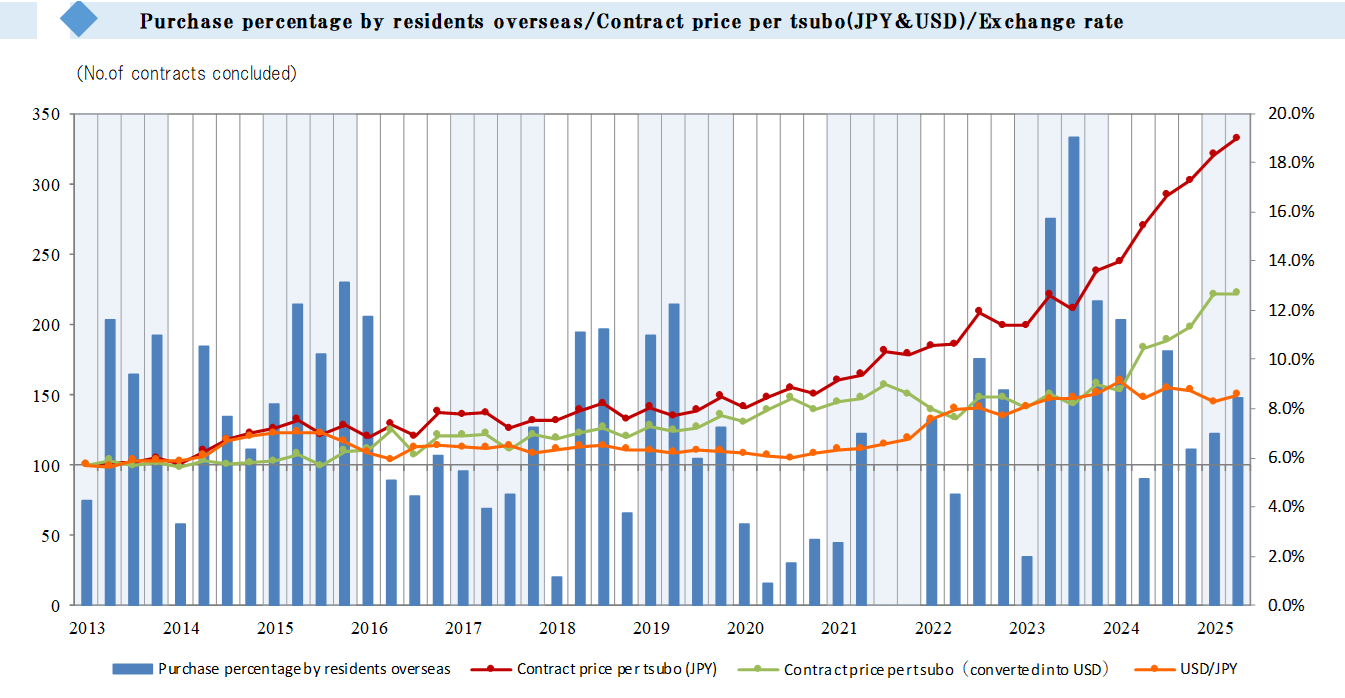
The chart above shows the percentage of purchases by overseas residents among Mitsui Fudosan Realty Group transactions and their contract prices per tsubo (JPY and USD) compared to the exchange rates.
The percentage of purchases by overseas residents rose by +1.4 ppt QoQ in this quarter, to 8.4%. The average price per tsubo in this quarter (converted to USD) was up sharply by $321 QoQ to $87,610. For the 5th consecutive quarter, this is the highest USD price per tsubo since the beginning of data collection as the effect of rising yen prices per tsubo exceeded that of the decreasing trend in the value of the yen.
Even as the number of contracts decreased this quarter for the first time in 4 quarters, the average contract price per tsubo set a new record high for the 9th consecutive quarter. The inventory for all 10 areas combined as of the end of this quarter was 1,066, up QoQ for the fifth consecutive quarter, by +8%. It will be worthwhile to note how this inventory will affect the number of contracts and the average contract price per tsubo in the ensuing quarters. It will be prudent to continue to keep a close watch on the market impacts of trends in the Nikkei Average, exchange rates, the global situation, and inbound demand in the coming quarters.
◆Source : Avg. Contact unit prices/No. of Contracts ---Based on the data regarding actual transactions contracted at Mitsui's Rehouse/Real Plan sales offices ( All of the Data compiled are subject to transactions of the premium condos designated by Mitsui Fudosan Realty).
Copyright© Mitsui Fudosan Realty Co., Ltd. All Rights Reserved.