Our Site uses cookies to improve your experience on our website. For more details, please read our Cookie Policy.
By closing this message or starting to navigate on this website, you agree to our use of cookies.
Our Site uses cookies to improve your experience on our website. For more details, please read our Cookie Policy.
By closing this message or starting to navigate on this website, you agree to our use of cookies.
This page is translated using machine translation. Please note that the content may not be 100% accurate.


Contact
Mitsui Fudosan Realty can provide a wide range of real estate services on both investment and residential properties.
Please feel free to give us a call or contact with mail inquiry.
Phone(English Line)
Contact Information by Region
- China400-120-1319
- HongKong800-93-3060
- Taiwan00801-81-2728
- Japan(English)0120-923-431
- Other Regions+81-3-6758-4072
This page is translated using machine translation. Please note that the content may not be 100% accurate.

PROPERTY MARKET TRENDS | 2Q 2025
PROPERTY MARKET TRENDS
2Q 2025
Residential: New condo supply decreased because of high prices in the Tokyo metropolitan area while sales were strong in the Kinki region
Offices: Favorable vacancy rates and average rents continued
Hospitality: Entry of upscale hotels was active
Residential
The new condo supply in the Tokyo metropolitan area remained at 1,000–2,000 units/month as supply decreased and prices continued to increase by area. The contract rate was favorable in the Kinki region, where supply trended at 1,000–1,500 units/month.
■ New condo. sales in Tokyo metropolitan area
・In September 2025, there was a new supply of 1,908 units (up 4.3% YoY), and the average initial sales price, floor area, and unit price were JPY 99.56 million (up 28.6% YoY), 67.95 sqm (up 0.1% YoY), and JPY 4.835 million per tsubo (up 27.6% YoY), respectively. The month-end inventory was 5,879 units, while the contract rate in the first month of sales was 54.4%, down 11.1 ppt YoY.
・There was a new supply by area of 542 units in the 23 wards of Tokyo, and the average initial sales price and unit price were JPY 137.64 million (up 27.7% YoY) and JPY 6.887 million per tsubo (up 34.7% YoY), respectively. The share of the supply was 28.4%, and the contract rate in the first month of sales was 53.3%, down 2.7 ppt YoY.
■New condo. sales in Kinki region
・In September 2025, there was a new supply of 1,492 units (up 16.6% YoY), and the average initial sales price, floor area, and unit price were JPY 51.42 million (down 12.0% YoY), 53.49 sqm (down 0.1% YoY), and JPY 3.172 million per tsubo (down 2.1% YoY), respectively. The month-end inventory was 2,907 units, while the contract rate in the first month of sales was 78.2%, down 2.6 ppt YoY. New supply increased YoY for the second consecutive month, and the contract rate in the first month of sales reached the upper 70% level.
■Second-hand condo. sales in Tokyo metropolitan area
・The number of contracts made in September 2025 was up +46.9% YoY to 4,475 units, rising for the 11th consecutive month, while the unit price per tsubo rose for the 65th consecutive month, reaching JPY 2.811 million (up 12.3% YoY). The contract price rose for the 11th consecutive month to JPY 53.52 million (up 10.1% YoY). Exclusive floor area was down 2.0% YoY to 62.83 sqm, while the inventory fell for the second consecutive month, to 43,850 properties (down 3.4% YoY).
・Even as the number of units newly listed fell for the third consecutive month to 15,356 units (down 5.2% YoY), the initial sales price increased by 28.7% YoY to JPY 58.67 million.
■Rental apartments in Tokyo metropolitan area
・The number of contracts made for rental apartments in April–June 2025 was 35,728 units (down 18.0% from Jan.-March 2025 in the previous period), and the 23 wards had a share of 60.2%.
・While residents increasingly are choosing rental apartments because of rising condo prices, market rents on rental apartments also appear to be rising, and numerous cases were apparent of reductions in product levels in the previous period. The product level seems to be recovering this period because floor area and rent levels both increased.
■Market overview
・In the Tokyo metropolitan area, the 23 wards had a share of 28.4% of the supply in September, down from 53.0% in August because supplies grew sharply in Saitama and Kanagawa Prefectures. Even though the average price in the 23 wards of Tokyo was high at roughly JPY 130–140 million, the contract rate in the first month of sales trended in the 50% to 70% range.
・Since prices are in an increasing trend, it is conceivable that supplies will continue to decrease, and numerous properties are going on the market later after completion of construction. With such apparent rescheduling, conditions in the sales market as a whole are considered to be fairly favorable even though the contract rate in the first month of sales is on the low side.

Office
Amid favorable market trends, the trends toward falling vacancy rates and rising rents continue nationwide. There has been a notable increase in numbers of major Japanese manufacturers relocating to new large-scale office buildings.
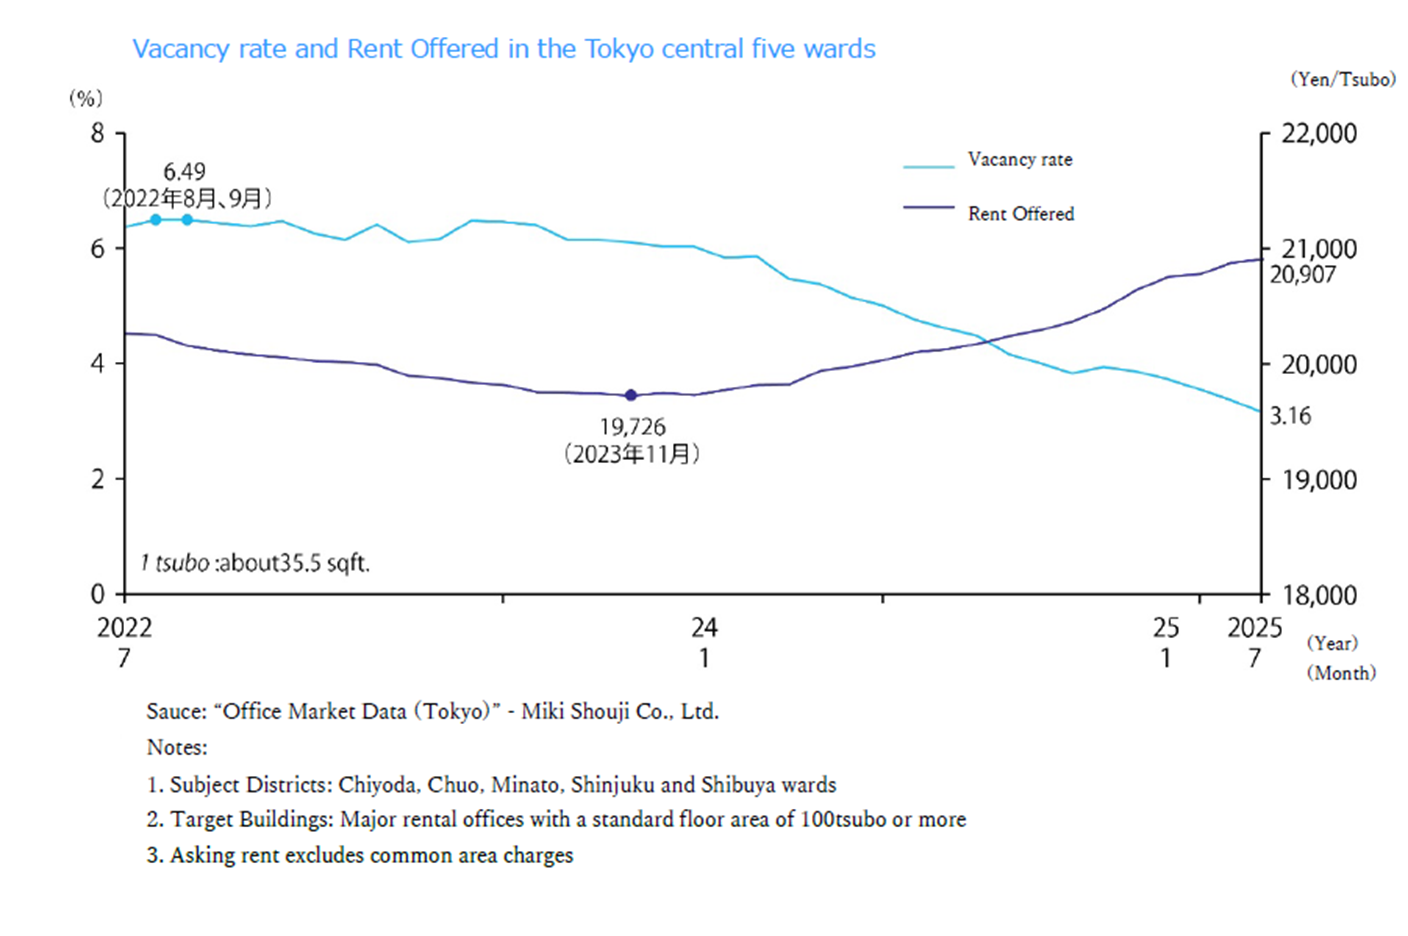
■Large-scale office buildings in Tokyo CBD (Central 5 Wards)
・As of August 2025, the vacancy rate had decreased by 0.31 ppt MoM to 2.85% below the 3% level. Vacant floor space decreased by approximately 25,000 tsubo in one month from July to August. At JPY 21,027/tsubo, average rent was up JPY 120 MoM and JPY 924 YoY, increasing for 19 consecutive months since January 2024.
・Total leased floor area was approximately 8,117,000 tsubo, up 93,404 tsubo YoY as six new office buildings came on the market.
・Vacancy rates fell MoM in all five central wards with rates in Chiyoda and Shibuya Wards both below 2%. Rent also increased MoM in Minato, Shinjuku, Chiyoda, and Chuo Wards. Falling vacancy rates and rising rents appear likely to continue for the time being since uncertainty because of US trade policies and other factors has had no major impact.
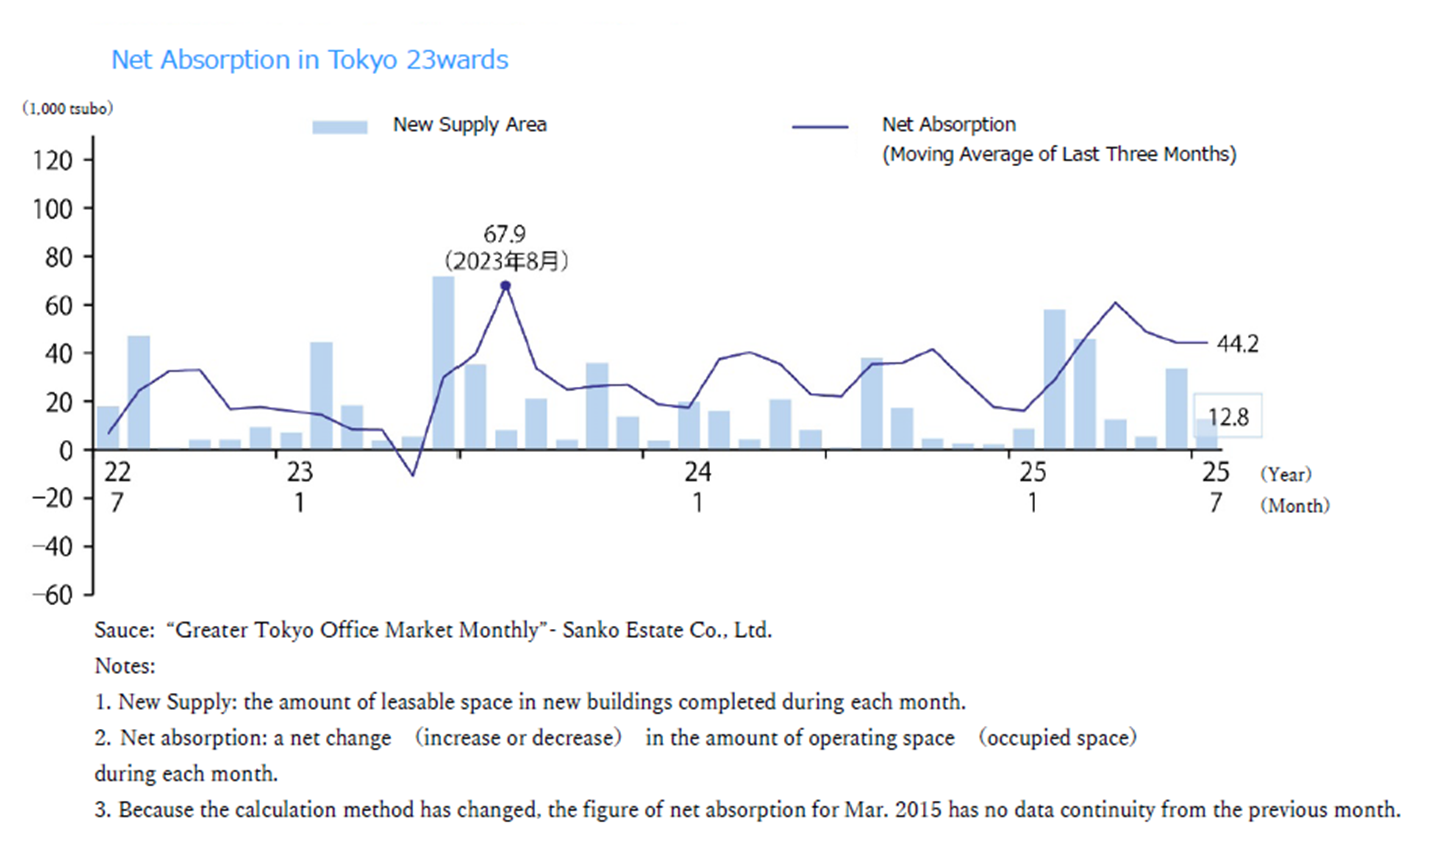
■Net absorption
・Net absorption (change in office occupied floor space) was +39,263 tsubo in August 2025 and a cumulative +371,262 tsubo since January 2025. This cumulative net absorption is up 128,030 tsubo compared to the same period last year.
・The vacancy rate on new buildings (completed less than one year ago) is 15.56%, down 3.5 ppt MoM. The rate improved from 21.51% in the same month last year.
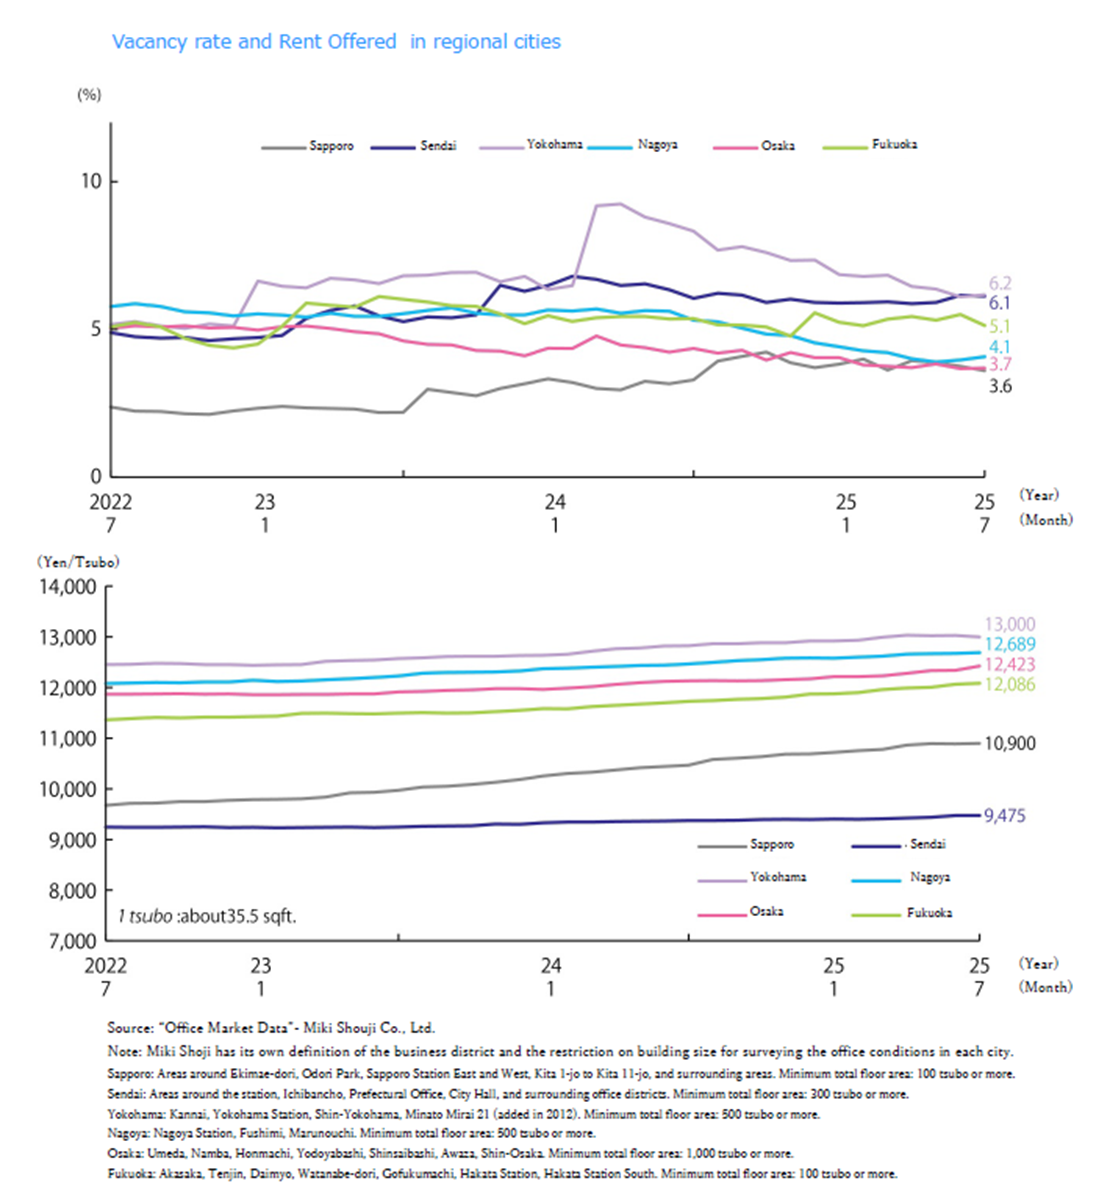
■Vacancy rates, and average rents in major regional cities / August 2025
・ Sapporo: Vacancy @ 3.54% down 0.06 ppt MoM. Average rent @ JPY 10,916 per tsubo up JPY +16 MoM. (Vacancy rate changed little, while average rent increased.)
・Sendai: Vacancy @ 6.02% down 0.10 ppt MoM. Average rent @ JPY 9,477 per tsubo up JPY +2 MoM. (Vacancy rate and average rent changed little.) ・Yokohama: Vacancy @ 5.91% down 0.26 ppt MoM. Average rent @ JPY 13,050 per tsubo up JPY +50 MoM. (Vacancy rate improved, while average rent increased)
・Nagoya: Vacancy @ 3.93% down 0.14 ppt MoM. Average rent @ JPY 12,726 per tsubo up JPY +37 MoM. (Vacancy rate improved slightly, while average rent increased.)
・Osaka: Vacancy @ 3.74% up 0.05 ppt MoM. Average rent @ JPY 12,522 per tsubo up JPY +99 MoM. (Vacancy rate changed little, while average rent increased.)
・Fukuoka: Vacancy @ 4.91% down 0.22 ppt MoM. Average rent @ JPY 12,108 per tsubo up JPY 22 MoM. (Vacancy rate improved, while average rent increased.)
Vacancy rates and vacant floor space improved in all five regions other than Osaka because favorable trends continue in regional cities amid falling vacancy rates and rising rents. The increase in Osaka's vacancy rate, too, is thought to be a temporary trend associated with reconstruction.
■Status quo and future market outlook
・According to a survey by the Xymax Real Estate Institute of industries to which tenants in new office buildings belonged, while occupants of new office buildings completed in 2016–2020 (approximately 458,000 tsubo) were made up of 34% IT firms, 19% manufacturers, and 12% financial firms, tenants in new office buildings completed since 2023 (approximately 173,000 tsubo, including tentative tenants) were made up of 30% manufacturers, 25% IT firms, and 17% telecommunications firms. Manufacturers accounted for the largest share of office demand, including a notable trend toward active relocation by major Japanese manufacturers.
・Another trend worthy of note in the corporate real estate (CRE) market is pressure to sell corporate real estate, which is led by foreign private-equity funds and other investors. Many funds are involved in domestic corporate real estate holdings, and there is thought to be the possibility that the sale of corporate real estate could be promoted to secure unrealized gains.
Hospitality
Demand for accommodations from inbound guests is driving strong guestroom utilization because some regions face a shortage of limited-service hotels with guestroom utilization rates reaching 80% or higher.
■Continued growth in inbound guests
・In August 2025, the total number of overnight stays in Japan was 66.817 million (up 0.8% YoY). Of these, the number of guests from overseas reached its highest monthly level for August since 2011 at 13.531 million. The top countries and regions represented in overnight stays by guests from overseas were China, Taiwan, and South Korea, followed by the United States and Hong Kong.
■Recent trends by category
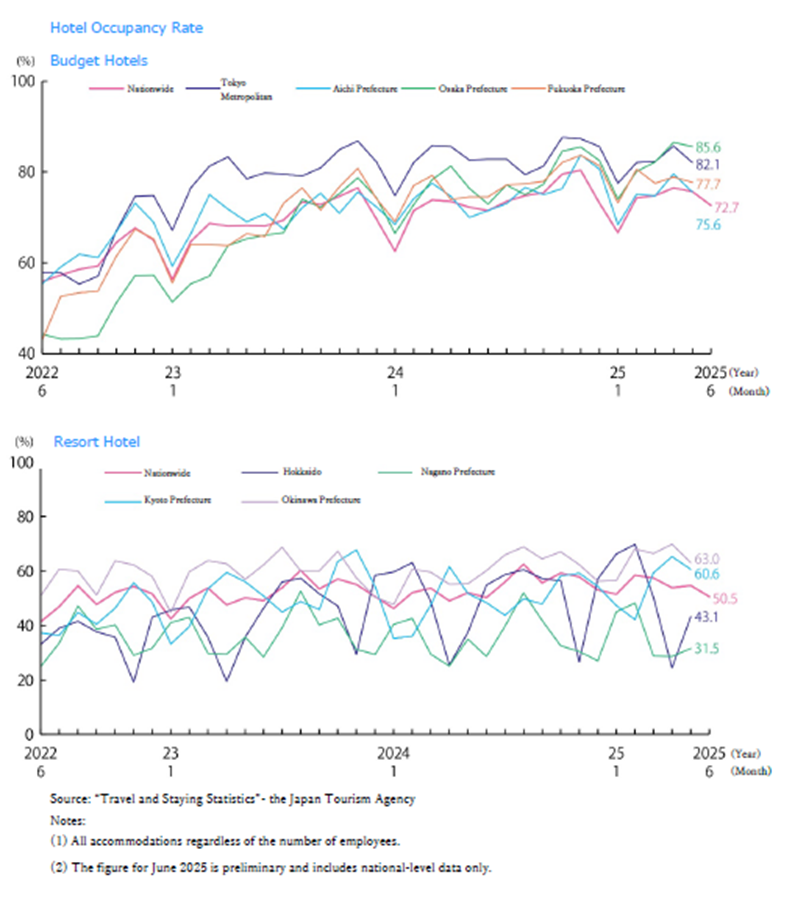
・Comparisons of the use of accommodations by guests from Japan and overseas in July 2025 show that 46.0% of Japanese guests (41.77 million) stayed at limited-service hotels, 14.3% at Japanese-style inns, and 13.8% at resort hotels, while 41.7% of guests from overseas (13.98 million) stayed at limited-service hotels and 29.1% at full-service hotels.
・Guestroom utilization rates (at facilities with 10 or more employees) in July 2025 were 49.9% for Japanese-style inns, 58.3% for resort hotels, 76.6% for limited-service hotels, and 71.6% for full-service hotels. Rates were highest for limited-service hotels and full-service hotels. The guestroom utilization rate for limited-service hotels exceeded 80% in eight districts: Hokkaido and Aomori, Akita, Nagano, Osaka, Hyogo, Saga, and Okinawa Prefectures, while the rate was 79.7% in Tokyo and 73.3% in Kyoto Prefecture.
■Inbound trends
・Inbound consumption in 2Q (April–June) 2025 was JPY 2.5043 trillion (up 17.0% YoY). Of this figure, 38.5% was for accommodations, 26.1% for shopping, 21.0% for food and beverages, 10.2% for transportation, and 4.1% for leisure and other services (estimated). British tourists spent the most (approximately JPY 440,000) on travel expenditures per person by nationality followed by Germans (approximately JPY 400,000).
・As intense shopping by tourists from China and elsewhere has cooled, customers are visiting stores, especially department stores, less often. At the same time, increasing numbers of visitors from overseas enjoy the consumption of cultural, traditional, and other experiences, and travelers are visiting an increasingly wide range of destinations. Lodging is concentrated in Tokyo, Osaka, Kyoto, and other areas with large numbers of hotels. To increase the numbers of visitors from overseas who stay in Japan's regions, it will be essential to create attractions and expand lodging space.
■Status quo and future market outlook
・A diverse range of luxury hotel properties is under development to target the upscale market. Such hotels that have opened since spring 2025 or plan to open in the future include the Fairmont Tokyo (Shibaura, opened in July), 1 Hotel Tokyo (Akasaka, planned to open this winter), JW Marriott Hotel Tokyo (Takanawa, opened in October), Fufu Tokyo Ginza (Ginza, opened in November), Waldorf Astoria Osaka (Umeda, opened in April), Patina Osaka (Bambacho, Chuo Ward, opened in May), Rosewood Miyakojima (Miyako Island, Okinawa, opened in March), and the Capella Kyoto (Higashiyama Ward, planned to open in early 2026) from the ultraluxury Singapore brand.
SC
Existing store sales for shopping centers (overall) increased by 6.9% YoY in August 2025 because the total figures for shopping centers continued to grow YoY for 42 consecutive months since March 2022.
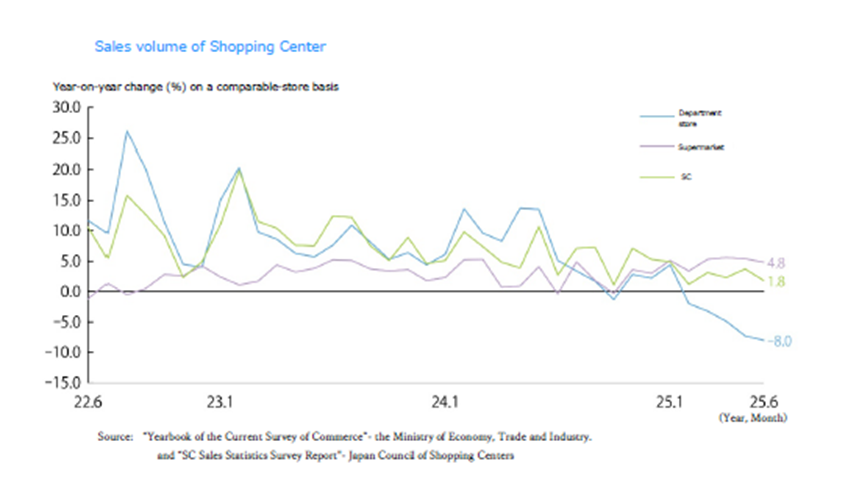
■Sales volume of shopping centers
・Existing store sales for shopping centers (overall) were approximately JPY 691.82 billion (up +6.9% YoY) in August 2025. Sales were up YoY thanks to the success of summer vacation events in attracting customers and the lack of extraordinary closures and shortened business hours due to typhoons, which had occurred last year.
・Department store sales in August 2025 rose by 2.6% YoY to approximately JPY 413.9 billion, returning to positive YoY growth for the first time in seven months. Inbound sales, which have been down YoY for six consecutive months, were down only 4.7% YoY vs. YoY decreases of 40.8% in May, 40.6% in June, and 36.3% in July. This was a sharp improvement, and the number of shoppers also reached a record high at approximately 500,000 (up 8.9%).
・Inbound demand grew sharply in 2023–2024, driving inbound consumption to more than JPY 8.1 trillion in 2024. While the growth in consumption by visitors from China has stalled, visitors from Europe and the Americas, including the USA and Italy, drove the growth in consumption.
■Status quo
・A look at the numbers of shopping-center tenants by type of business from the 2025 Shopping Center White Paper shows a 3.4 ppt decrease in retailers and 0.1 ppt and 3.3 ppt increases in food and beverage and service tenants compared to 2015. Compared to 2014, the number of shopping centers occupying commercial buildings fell by 4.6% (from 2,653 to 2,529 facilities), while the number occupying residential buildings fell by 19.7% (from 81 to 65 facilities) and the number in office buildings increased by 13.9% (from 43 to 49 facilities).
・By store floor area, compared to 2014, the number of facilities (shopping centers) of 20,000 sqm or more increased from 741 to 857 facilities, but the number of those less than 5,000 sqm in area fell from 584 to 395 facilities. One-third of the decrease in facilities was due to closure as control of the shopping-center market by large-scale facilities progressed.
Logistics
Slow new supply led to lower vacancy rates in the Tokyo metropolitan area market in 2025, while demand is strong in the Kinki, Chubu, and Fukuoka regions despite projected large-scale new supply.
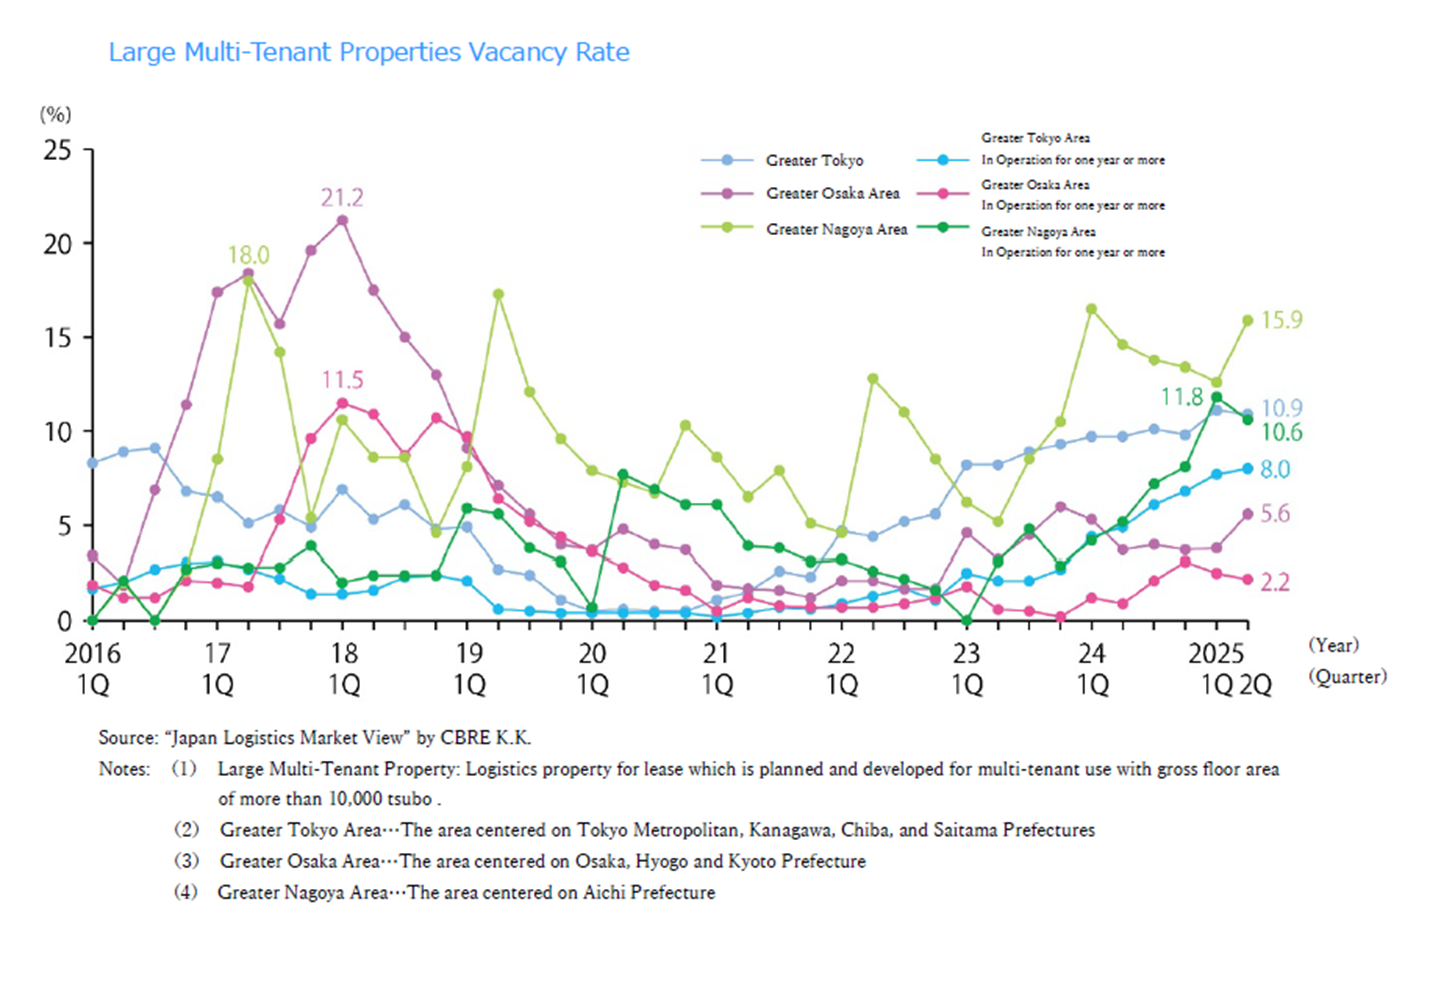
■Market conditions in the Tokyo metropolitan area and conditions by area in 2Q 2025
・The vacancy rate for large multi-tenant (LMT) logistics facilities was 10.9% (down 0.2 pt QoQ). Of the four new facilities (87,000 tsubo) coming on the market, two had large vacancies remaining but the other two were full on completion of construction. The utilization rate on completion is just under 70%. Among existing properties, while demand from such tenants as e-commerce firms and manufacturers resulted in the conclusion of large contracts on new and relatively newer properties, there also were numerous vacancies by large-scale tenants so that new demand was only 91,000 tsubo. Effective rent was JPY 4,480 per tsubo (up 0.8%) in the Tokyo metropolitan area overall, down 0.2 pt QoQ.
・The vacancy rate and effective rent in each area are as follows:
In the Tokyo Bay area, the vacancy rate was 5.8% (down 1.5 ppt QoQ), and rent was JPY 7,670 per tsubo (up 0.7%). Vacancies have become somewhat scarce as smaller spaces are being filled in existing properties.
In the Tokyo Gaikan Expressway area, the vacancy rate was 6.1% (flat), and rent was JPY 5,320 per tsubo (up 0.4 ppt). While once again there was no new supply during this period, tenant activity dulled as vacancies on relatively newer properties were unfilled.
Attention is focusing on trends among properties planned for completion in Saitama Prefecture in the next period and beyond. In the National Route 16 area, the vacancy rate was 9.3% (down 1.2 ppt), and rent was JPY 4,550 per tsubo (up 0.2%). One new facility was completed with full occupancy in Kanagawa Prefecture. Contracts also were concluded on multiple large areas in existing properties, and vacancies are being filled in Kanagawa, Saitama, and Chiba Prefectures.
In the Metropolitan Intercity Expressway area, the vacancy rate was 18.7% (up 1.7 ppt), and rent was JPY 3,470 per tsubo (down 1.1%). All three of the new facilities coming on the market were in Ibaraki Prefecture, and two were completed with large-scale vacancies remaining, driving up the vacancy rate. New demand, at 15,000 tsubo, was much lower than the past average.
■Market condition in other regions
・Vacancy rates and effective rents in other areas are as follows:
In Kinki region, the vacancy rate was 5.6% (up 1.8 ppt YoY), and rent was JPY 4,230 per tsubo (flat). New supply was 120,000 tsubo (five facilities), and new demand was 72,000 tsubo. Despite high new demand, high supply drove the vacancy rate up. Demand was high in Shiga and Nara Prefectures, and vacancies were filled in suburban locations. Although new supply is planned in the second half as well, the vacancy rate is expected to drop with the steady progress of leasing activities.
Chubu region: The vacancy rate was 15.9% (up 3.3 ppt), and rent was JPY 3,720 per tsubo (up 1.4%). New supply was 112,000 tsubo (five facilities), and new demand was 66,000 tsubo as both supply and demand reached their third highest levels on record. While the vacancy rate increased, it is expected to improve as market conditions are favorable, and no new supply is planned in 3Q. The trend among high-rent properties completed in good locations is driving market rents up.
Fukuoka region: The vacancy rate was 3.0% (down 1.2 ppt), and rent was JPY 3,580 per tsubo (up 0.3%). Vacancies were filled in existing properties, reducing the vacancy rate because there was no new supply during the period. As of the end of 2Q, four properties had vacancies. The narrow range of choices available has stimulated activity, and rising rents associated with reduced vacancies in the areas around the city of Fukuoka have resulted in a sharp increase in market rents.
■Future market outlook
・New supply of space projected in 3Q 2025 through 2Q 2026 is 360,000–370,000 tsubo in the Tokyo metropolitan area, 270,000–280,000 tsubo in Kinki region, 140,000–150,000 tsubo in Chubu region, and approximately 90,000 tsubo in the Fukuoka region.
・In the Tokyo metropolitan area, where new supply had continued at a rate of 150,000 tsubo or more per quarter, new supply is expected to be restrained over the coming year. Growing demand, led by numerous inquiries from business fields other than e-commerce in areas near the central city, should reduce vacancy rates. At the same time, increasing scarcity is projected to drive rent levels up.
・New supply of 300,000 tsubo or more is planned in the Kinki region in 1Q to 3Q 2025, where diverse demand from consumer goods (including e-commerce), manufacturing, and other industries is projected to drive steady filling of vacancies even if the vacancy rate increases temporarily. However, because of the further polarization of rents due to differences in access and other conditions, there is a possibility that rent increases could be limited to only some areas.
・New supply in Chubu region in 2Q and 4Q 2025 will total 200,000 tsubo, driving the vacancy rate up. However, new demand from industries including e-commerce can be expected to lead to steady filling of vacancies. Even so, this is not expected to lead to rent increases, since in light of the size of Chubu market, demand should not reach excessive levels.
・While new supply in Fukuoka region has settled to roughly 20,000–30,000 tsubo per quarter, because of the high levels of new supply over the past few years, there is little expectation of a sharp decrease in the vacancy rate. On the other hand, new supply from such infrastructure-related businesses as Kyushu Electric Power and JR Kyushu could drive rent levels higher.
・While tenants are increasingly active in such markets as Sapporo, Sendai, Okayama, and Hiroshima as well, there is little new supply in these markets and demand exceeds supply in many areas. High utilization and rising rent levels are expected to continue for the time being.
J-Reit
AUM is growing in hospitality and office REITs, for which conditions remain favorable, and the first hospitality REIT IPO in four years took place in the quarter.
■J-Reit market trend
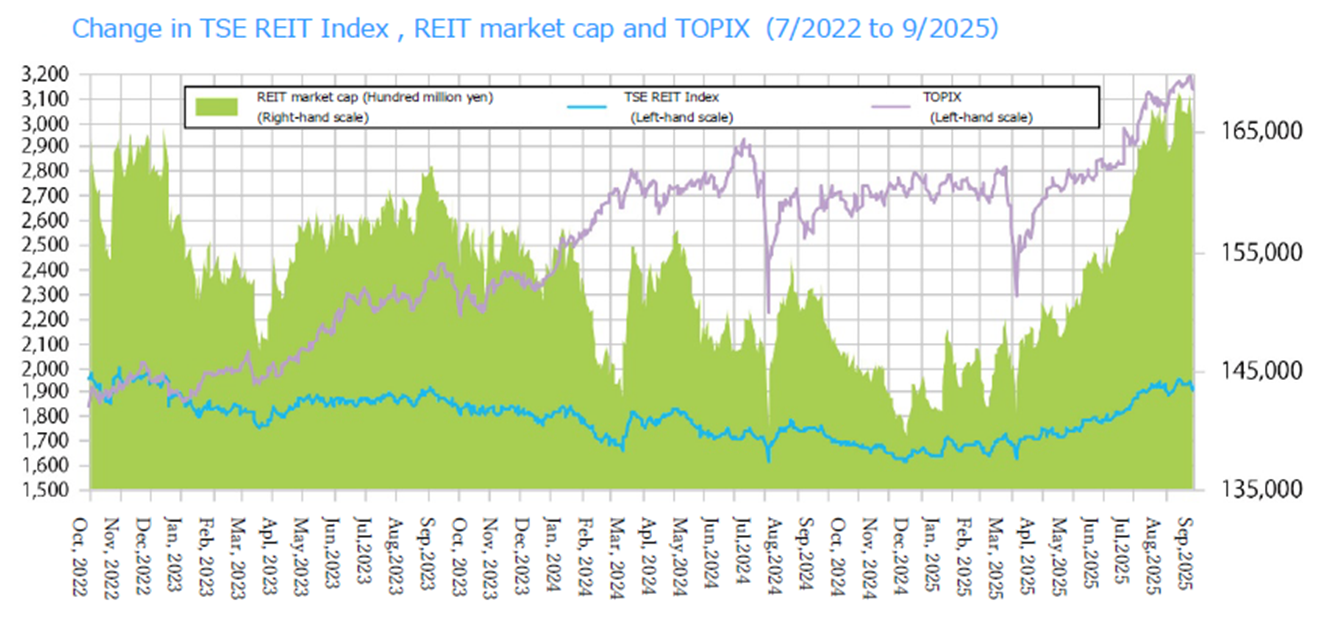
・At the end of September 2025, the TSE REIT index was 1,921.07, up 8.0% from June, and market capitalization of all J-REITs was JPY 16.5907 trillion, up 8.2% from June. Factors behind the recovery in investment unit market prices since the start of 2025 include increased returns to investors because REITs have switched to investment with a focus on capital efficiency, further strengthening of the upward trends in office and residential rents, a sharp increase in variable rents on hotels backed by growing inbound demand, and continued growth in dividends.
・The aggregate AUM of J-REIT's grew by JPY 123.9 billion from June to JPY 23.9508 trillion as of the end of September. While the numbers of hotel and office properties, for which rents can be expected to increase, have risen, those of logistics facilities and suburban retail facilities, which are comparatively less sensitive to rising rents, have decreased.
・Backed by the recovery in investment unit market prices and favorable hotel market conditions, Kasumigaseki Hotel REIT Investment Corporation conducted its IPO in August, the first new IPO since 2021, four years ago.
・No existing REITs have conducted IPOs since that of Nippon Building Fund Inc. in June, and the number of IPOs in 2025 remains at only three. Despite the recovering trend in investment unit market prices, the average NAV ratio (net asset ratio based on current value of real estate) remains less than one. In addition, in the current environment in which it is difficult to secure appropriate yields because of rising real estate prices, REITs are aiming to increase investment unit prices further by increasing capital efficiency through such means as distributing gains from sale of properties and using proceeds from the sale to buy back their own investment units, as well as working to improve their portfolios' earnings and quality through replacement of assets, instead of IPOs.
■Future market outlook
・Since acquiring real estate in major urban areas is a challenge, investors are taking steps to expand their areas of investment to include regional cities and overseas, expand the purposes of investment, and use bridge funds to secure preferential negotiating rights for the future.
・The trend is increasing toward indicating a target of stable medium- to long-term dividends, since rents can be expected to increase further on office and residential properties.