Our Site uses cookies to improve your experience on our website. For more details, please read our Cookie Policy.
By closing this message or starting to navigate on this website, you agree to our use of cookies.
Our Site uses cookies to improve your experience on our website. For more details, please read our Cookie Policy.
By closing this message or starting to navigate on this website, you agree to our use of cookies.
This page is translated using machine translation. Please note that the content may not be 100% accurate.


Contact
Mitsui Fudosan Realty can provide a wide range of real estate services on both investment and residential properties.
Please feel free to give us a call or contact with mail inquiry.
Phone(English Line)
Contact Information by Region
- China400-120-1319
- HongKong800-93-3060
- Taiwan00801-81-2728
- Japan(English)0120-923-431
- Other Regions+81-3-6758-4072
This page is translated using machine translation. Please note that the content may not be 100% accurate.

Quarterly Report for Premium Condominiums in Tokyo | 4Q FY 2025
【Chart 1】
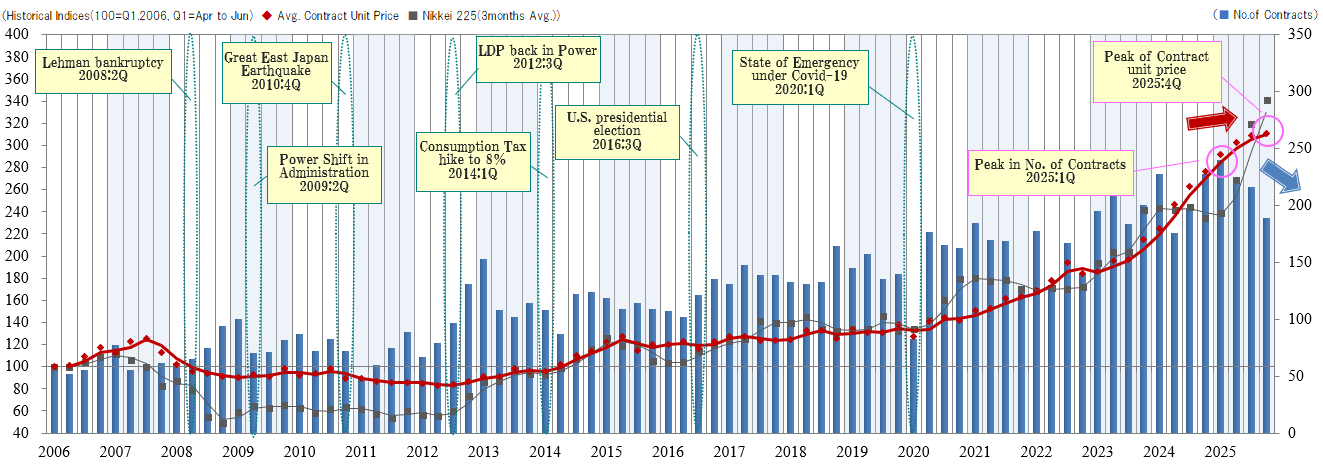
In this chart, the trends in the average transaction price per tsubo (*) and the number of transactions across the eight premium residential areas (**) are examined objectively by cross-referencing them with simultaneous economic topics and the Nikkei Stock Average.
Looking at the overall trend for premium condominiums (above), the average transaction price index for the current quarter (2025 Q4) rose by 1.4 points from the previous quarter to 310.4, marking the eleventh consecutive period in which it reached a new record high since tracking began. Meanwhile, the number of transactions decreased by 27 cases quarter-on-quarter to 189, representing a decline for three consecutive periods.
*Tsubo: Tsubo is a Japanese traditional unit of area equal to approx. 3.31sqm
**Eight premium residential areas: Roppongi / Akasaka / Toranomon; Azabu / Azabu-Juban / Mita; Shirokane / Takanawa; Aoyama / Shibuya; Hiroo / Daikanyama / Ebisu ;Bancho / Kojimachi / Iidabashi; Ichigaya / Yotsuya; and Ginza
【Chart 2】
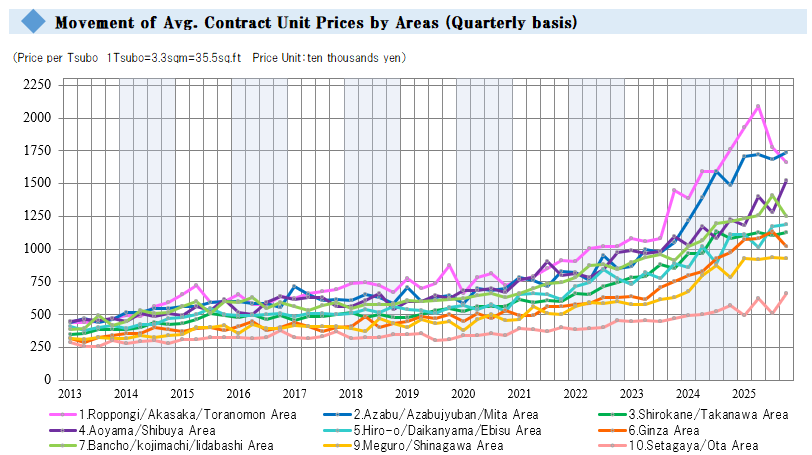
The above chart illustrates the trend in average transaction prices by area. In the current quarter, average transaction prices increased in five areas: Azabu / Azabu-Juban / Mita; Shirokane / Takanawa; Aoyama / Shibuya; Hiroo / Daikanyama / Ebisu; and Setagaya / Ota. Among these, four areas—Azabu / Azabu-Juban / Mita; Aoyama / Shibuya; Hiroo / Daikanyama / Ebisu; and Setagaya / Ota—recorded their highest levels since tracking began. In contrast, prices declined in five areas: Roppongi / Akasaka / Toranomon; Ginza; Bancho / Kojimachi / Iidabashi; Ichigaya / Yotsuya; and Meguro / Shinagawa.
【Chart 3】
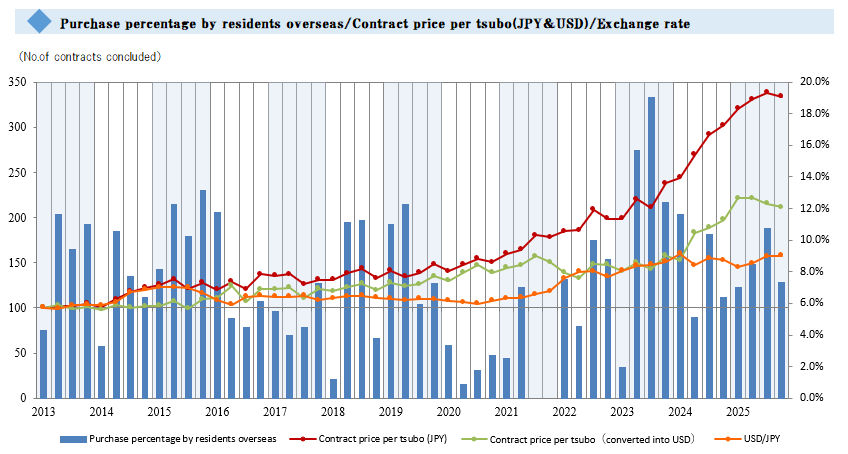
This chart analyzes the proportion of purchases by overseas residents among transactions handled by Mitsui Fudosan Realty Group, together with transaction prices per tsubo (in JPY and USD) and exchange rate movements.
The ratio of purchases by overseas residents decreased by 3.5 percentage points from the previous quarter to 7.3%. The unit price per tsubo in USD also declined for the second consecutive period, falling by $1,677 quarter-on-quarter to $83,383.
In summary, while the number of transactions declined for three consecutive periods this quarter, the average transaction price per tsubo continued to reach new record highs for eleven consecutive periods. In addition, the number of listings at the end of the current period across the ten areas (***) increased for the seventh consecutive period to 1,354 units (+186 quarter-on-quarter), and close attention is needed regarding the impact on future transaction volumes and prices.
It remains important to continue monitoring future market trends in relation to movements in the Nikkei Stock Average, exchange rates, global economic conditions, and buyers from overseas.
***Ten areas: Eight premium residential areas + Meguro / Shinagawa; and Setagaya / Ota
◆Source : Avg. Contact unit prices/No. of Contracts ---Based on the data regarding actual transactions contracted at Mitsui's Rehouse/Real Plan sales offices ( All of the Data compiled are subject to transactions of the premium condos designated by Mitsui Fudosan Realty).
Copyright© Mitsui Fudosan Realty Co., Ltd. All Rights Reserved.