Our Site uses cookies to improve your experience on our website. For more details, please read our Cookie Policy.
By closing this message or starting to navigate on this website, you agree to our use of cookies.
Our Site uses cookies to improve your experience on our website. For more details, please read our Cookie Policy.
By closing this message or starting to navigate on this website, you agree to our use of cookies.
This page is translated using machine translation. Please note that the content may not be 100% accurate.


Contact
Mitsui Fudosan Realty can provide a wide range of real estate services on both investment and residential properties.
Please feel free to give us a call or contact with mail inquiry.
Phone(English Line)
Contact Information by Region
- China400-120-1319
- HongKong800-93-3060
- Taiwan00801-81-2728
- Japan(English)0120-923-431
- Other Regions+81-3-6758-4072
Contact
Mitsui Fudosan Realty can provide a wide range of real estate services on both investment and residential properties.
Please feel free to give us a call or contact with mail inquiry.
Phone(English Line)
Contact Information by Region
- China400-120-1319
- HongKong800-93-3060
- Taiwan00801-81-2728
- Japan(English)0120-923-431
- Other Regions+81-3-6758-4072
This page is translated using machine translation. Please note that the content may not be 100% accurate.

PROPERTY MARKET TRENDS 1Q FY 2026

PROPERTY MARKET TRENDS
FY 1Q 2026
■ Office:In the Greater Tokyo market, vacancy rates in Chuo Ward and Minato Ward also remained in the 2% range, while in the major regional city markets, vacancies increased in Sapporo, Sendai, and Fukuoka.
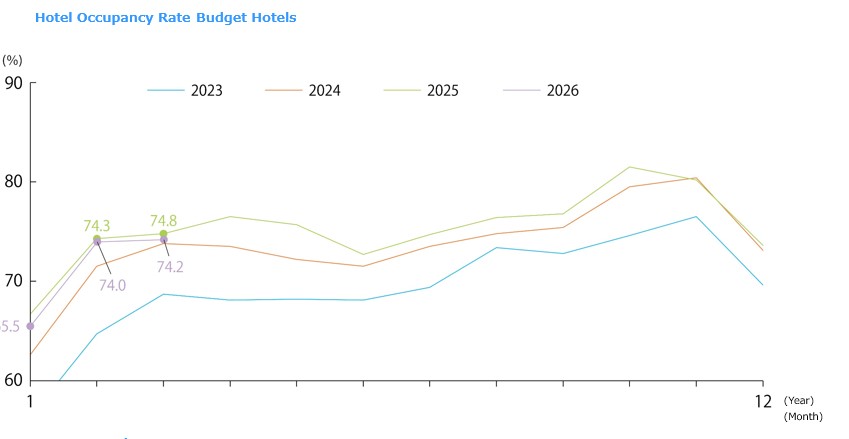
■ Hotel:Room occupancy rates are on an improving trend, at 74.3% for business hotels and 72.5% for city hotels.
■ Logistics:In the Greater Tokyo and Kinki regions, demand is strong, and the trend of declining vacancy rates and rising rents continues.
Residential
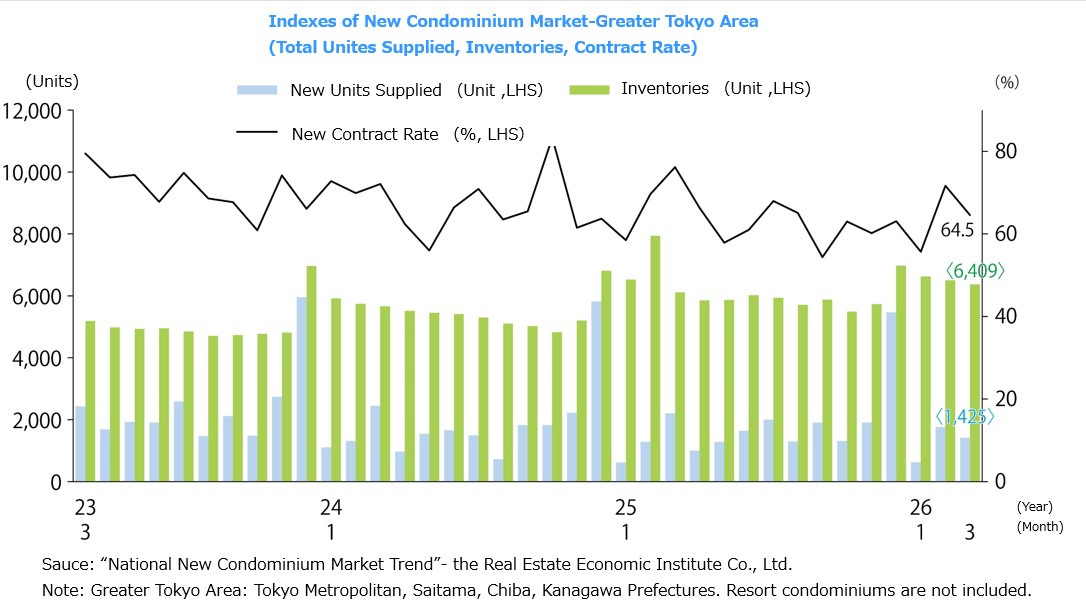
The supply of newly built condominiums in the Greater Tokyo Area is on a recovery trend, while the contract rate continues to be sluggish due to soaring prices.
■ New Condominiums in the Greater Tokyo Area
• The number of units supplied in April 2026 was 1,163 units (+15.6% year-on-year), and the average asking price, average area, and average unit price were ¥87.36 million (+24.8%), 66.89 sq.m. (+0.1%), and ¥4.310 million per tsubo (+24.6%), respectively. The month-end inventory was 6,313 units, and the first-month contract rate was 62.3% (-4.0 percentage points year-on-year).
• The number of units supplied by area in Tokyo’s 23 wards was 352 units, and the average asking price and average unit price were ¥124.98 million (+38.9%) and ¥6.475 million per tsubo (+34.1%), respectively. The supply share was 30.3%, and the first-month contract rate was 65.1% (+9.6 percentage points year-on-year).
■ New Condominiums in the Kinki Region
• The number of units supplied in April 2026 was 1,197 units (-12.6% year-on-year), and the average asking price, average area, and average unit price were ¥59.84 million (+6.2%), 58.41 sq.m. (+7.0%), and ¥3.381 million per tsubo (-0.9%), respectively. The month-end inventory was 3,250 units, and the first-month contract rate was 75.5% (-1.5 percentage points year-on-year). Compared with the same month of the previous year, the price rose for the first time in two months, and the price per tsubo declined for the first time in seven months.
■ Existing Condominiums in the Greater Tokyo Area
• The number of transactions in April 2026 was 3,903 (-1.2% year-on-year), decreasing for the first time in 18 months. The price per tsubo was ¥2.836 million (+5.9%), rising for the 72nd consecutive month. The transaction price was ¥53.21 million (+5.4%), rising for the 18th consecutive month. The exclusive floor area was 61.92 sq.m. (-0.5%), and the number of inventory units was 45,215 (+2.7%), increasing for the second consecutive month.
• The number of new listings was 16,142 (+1.6% year-on-year), turning positive for the first time in three months, and the asking price was ¥65.39 million, up 30.7% from the previous year.
■ Rental Condominiums in the Greater Tokyo Area
• In April 2026, rents for condominium apartments in the Greater Tokyo Area rose for the first time in two months to ¥4,143 per sq.m. (+11.0% year-on-year). Influenced by strength in Tokyo and an expanded share of examples, they exceeded the highest level in the most recent one-year period.
• With the soaring prices of condominium apartments, many users still appear to be switching to rental apartments. However, because of rising rental market levels and the limited supply of new properties due to soaring construction costs, rental demand is shifting toward suburban areas; the number of transactions decreased by 10% in Tokyo’s 23 wards and by 17% in Yokohama and Kawasaki.
■ Market Trends
• According to the forecast announced by the Real Estate Economic Institute Co., Ltd. at the end of 2025, condominium supply in the Greater Tokyo Area in 2026 is expected to be approximately 23,000 units, up 2.2% year-on-year. While the increase is expected to consist mainly of large-scale properties in suburban Tokyo and Chiba Prefecture, supply in Tokyo’s 23 wards is expected to decrease because new large-scale properties will decline. However, the popularity of Tokyo’s 23 wards remains high, and prices are expected to remain high because of a sense of scarcity.
• Since 2022, annual supply of condominium apartments in the Greater Tokyo Area has continued to be below 30,000 units, and needs have steadily accumulated. However, because prices have been too high and out of reach, over the past two to three years demand has flowed to relatively affordable properties in areas such as Chiba, Saitama, and Kanagawa that are somewhat away from central Tokyo. At present, suburban properties have also continued to rise in price, and cases in which prices exceed the budgets of buyer groups in surrounding areas are increasing, resulting in a situation in which sales are slowing overall. • In the Kinki region, even with supply volumes comparable to those in the Greater Tokyo Area, the first-month contract rate is showing firm movement; however, with the price per tsubo falling below the same month of the previous year, it can be sensed that the limit of price increases is approaching.
Office
In the Greater Tokyo market, vacancy rates in Chuo Ward and Minato Ward also declined to the 2% range, while in Sapporo, Sendai, and Fukuoka, vacancies increased, raising concerns about the outlook.
■ Large-Scale Offices in the “Tokyo Business District (Central Five Wards)”
• The average vacancy rate in April 2026 was 2.20% (-0.02 percentage points month-on-month), declining for the first time in three months.
• The average rent was ¥22,454 (+¥152 month-on-month and +¥1,699 year-on-year).
• By ward, vacancy rates declined month-on-month in Minato Ward and Shinjuku Ward, while vacancy rates in Chiyoda Ward and Shibuya Ward were below 1.5%. Average rents rose month-on-month in the four wards other than Chiyoda Ward.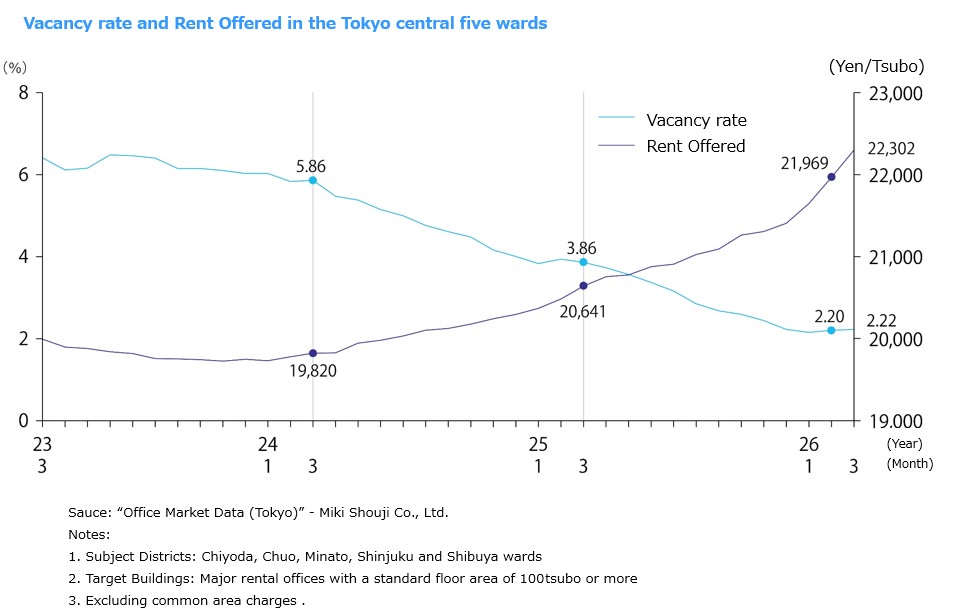
■ Net absorption
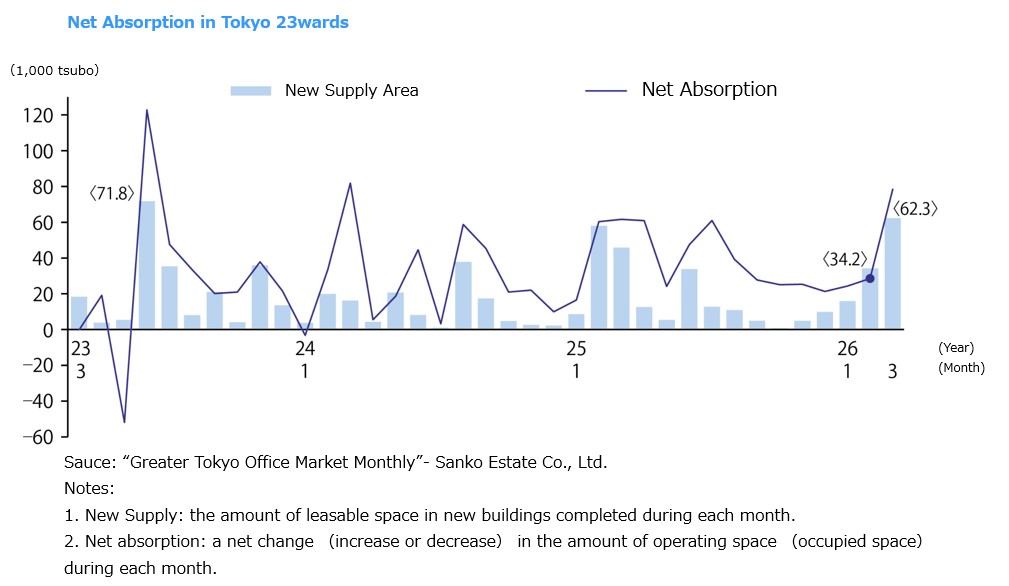
• Net absorption in Tokyo’s 23 wards was +8,997 tsubo, and the cumulative total for January through April 2026 was +140,347 tsubo. This is 59,055 tsubo lower than the same period of the previous year.
■ April 2026 Vacancy Rates and Average Rents in Major Regional Cities
• Sapporo: 3.90%, +0.35 percentage points month-on-month; ¥11,210 per tsubo, +¥72 month-on-month (vacancy rate worsened, average rent rose).
• Sendai: 5.41%, +0.05 percentage points month-on-month; ¥9,662 per tsubo, +¥30 month-on-month (vacancy rate almost flat, average rent rose).
• Yokohama: 5.91%, -0.07 percentage points month-on-month; ¥13,283 per tsubo, +¥46 month-on-month (vacancy rate almost flat, average rent rose).
• Nagoya: 3.61%, -0.21 percentage points month-on-month; ¥13,118 per tsubo, +¥60 month-on-month (vacancy rate improved, average rent rose).
• Osaka: 3.09%, -0.11 percentage points month-on-month; ¥13,126 per tsubo, +¥57 month-on-month (vacancy rate improved, average rent rose).
• Fukuoka: 4.67%, +0.18 percentage points month-on-month; ¥12,467 per tsubo, +¥22 month-on-month (vacancy rate worsened, average rent rose).
Vacancy rates improved in Nagoya and Osaka, while rents rose in all districts, and favorable movement continues. 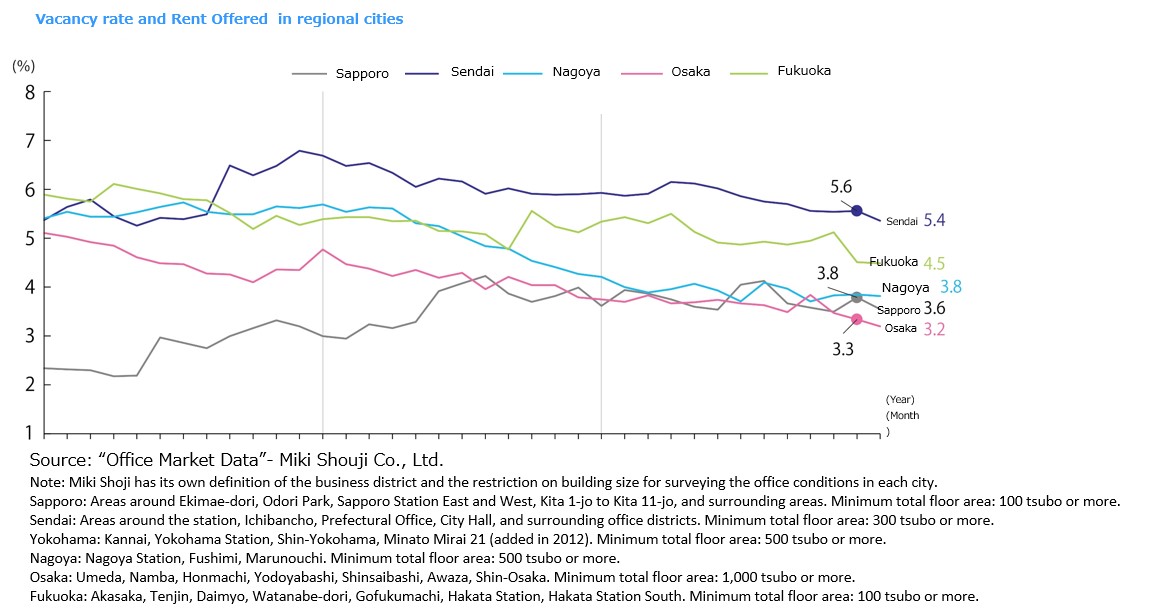
■ Current Analysis and Future Forecast
• In Chiyoda Ward and Shibuya Ward, where vacancy rates are in the 1% range, offices are not easy to find, and rents are also on an upward trend reflecting a sense of limited supply.
• Chuo Ward and Shinjuku Ward, where vacancies had been comparatively abundant and rents had been relatively low, have also fallen below a 3% vacancy rate, and a sense of limited supply is beginning to emerge.
• In Chiyoda Ward, Chuo Ward, and Minato Ward, rents rose by approximately ¥1,700 to ¥2,300 per tsubo over the most recent one-year period. Redevelopments around Tokyo Station, Hamamatsucho Station, and Mita Station, together with newly built large-scale tower offices, significantly lifted the market level.
• Against the background of soaring construction costs and material prices, reviews of new supply plans are increasing. Added to this is the worsening labor shortage, which has worsened the profitability of office development, leading to a series of postponements and reductions in plans. The historically large supply volume that had been expected for 2028 to 2029 was also revised downward significantly.
Hotel
Overall, including domestic demand, the number of guest nights recovered to 50 million or more after March 2026, while inbound overnight guests from China declined sharply year-on-year.
■ Total Overnight Guests Are on a Declining Trend
• The total number of domestic overnight guests in April 2026 was 50.63 million guest nights (-4.6% year-on-year). The breakdown of overnight guests was 34.90 million Japanese guest nights and 15.73 million foreign guest nights. The total number of overnight guests has continued to decline year-on-year since June 2025, and the number of foreign overnight guests has continued to decline year-on-year since March 2026.
■ Trends by Category
• By type of accommodation facility in April 2026, the total number of overnight guests was 20.851 million guest nights for business hotels (share: 41.2%), 8.871 million guest nights for city hotels (17.5%), and 6.432 million guest nights for resort hotels (12.7%).
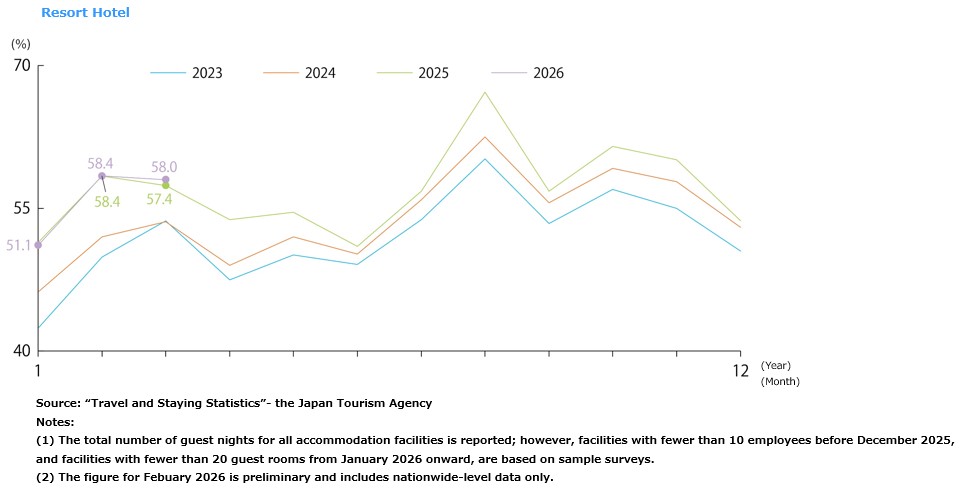
• In April 2026, room occupancy rates for facilities with 10 or more employees were 40.3% for ryokan, 54.5% for resort hotels, 74.3% for business hotels, and 72.5% for city hotels, continuing the rising trend in occupancy rates since January 2026. In the March 2026 data, high occupancy rates were recorded: 85.7% in Chiba Prefecture for resort hotels, 80.6% in Kanagawa Prefecture for business hotels, and 84.6% in Kagawa Prefecture for city hotels.
■ Inbound Trends
• In March 2026, by nationality/region of origin, the total number of foreign overnight guests ranked Taiwan first, the United States second, South Korea third, China fourth, and Hong Kong fifth; the top five countries and regions accounted for 53.1% of the total.
• Compared with the same month of the previous year, the overall number decreased by 1.4%, while large increases were seen in Indonesia (+52.5%), Malaysia (+36.5%), and Russia (+35.3%).
■ Current Trends and Future Forecast
• The estimated amount of travel consumption by foreign visitors to Japan in 2026 1Q (January to March) was ¥2.3378 trillion, up 2.5% year-on-year and down 7.6% from the previous quarter (2025 4Q). By nationality/region, Taiwan accounted for ¥388.4 billion, South Korea ¥318.2 billion, China ¥271.5 billion, the United States ¥259.2 billion, and Hong Kong ¥148.2 billion; the top five countries and regions accounted for approximately 60% of the consumption amount. The top countries by travel expenditure per person were France at ¥408,000, Australia at ¥404,000, and Germany at ¥399,000.
• The share by expenditure item is estimated at 36.7% for accommodation, 25.2% for shopping, and 22.9% for food and beverages. In actual amounts, accommodation expenses increased by approximately ¥93.0 billion year-on-year, while shopping expenses decreased by approximately ¥82.0 billion.
• Due to the impact of dynamic pricing, which has been introduced at many hotels in recent years, a decline in occupancy is highly likely to directly lead to a decline in sales, and early responses to such risks are required.
Commercial
The decline in inbound demand at department stores is tending to be resolved; although the number of customers decreased, sales increased by 4.3% year-on-year.
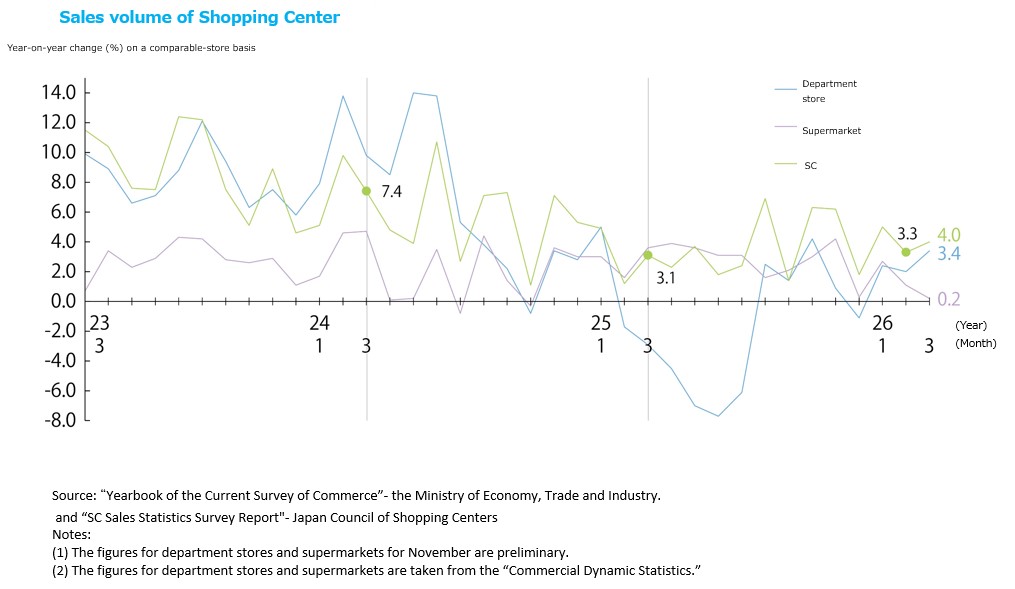
■ Sales Conditions at Shopping Centers
• According to the announcement by the Japan Council of Shopping Centers, existing shopping center sales in April 2026 (overall) were ¥663.58 billion, an increase of 4.3% year-on-year. Nationwide, due to rising temperatures, sales of seasonal products such as summer clothing were strong, and demand related to new lifestyles and outings during spring vacation also remained firm. In “miscellaneous goods,” summer products such as UV-protection items were also strong. “Food and beverage” and “services” also continued to show a favorable tone.
• According to the Japan Council of Shopping Centers’ “Shopping Center White Paper 2026,” the number of shopping centers newly opened nationwide in 2025 was 18, the fewest since the survey began in 1975. Factors behind the decline include “soaring construction costs,” “rising transportation costs,” and “soaring personnel costs,” and it is considered that openings were limited to shopping centers for which sufficient profitability could be expected.
■ Current Trends
• In recent years, there has been a stronger movement not only to have commercial functions but also to connect with local communities. By incorporating administrative services, medical care, education, public spaces, and other functions, some shopping centers have emerged that play the role of infrastructure supporting daily life. Going forward, this trend is expected to strengthen further, and shopping centers are expected to further reinforce their role not merely as “sales floors” but as “regional foundations,” while making use of their scale and functions.
• The three properties opened in 2025 — “Mitsui Shopping Park LaLa Terrace Kawaguchi,” “Maruhiro Ageo SC,” and “Ichi*Building” — are renovated properties in buildings that had formerly operated as department stores. Mitsui Shopping Park LaLa Terrace Kawaguchi was the former Sogo Kawaguchi department store; Mitsui Fudosan Co., Ltd. acquired the building, renovated it, and converted it into a shopping center. Maruhiro Ageo SC was the former Maruhiro Ageo department store; the building owner, Maruhiro Department Store Co., Ltd., renovated it and converted it into a shopping center. Ichi*Building is a building formerly occupied by Meitetsu Department Store Ichinomiya Store, which was renovated and converted into a shopping center by the group company Meitetsu Property Management Co., Ltd. Thus, the “conversion to shopping centers” of department store properties in urban areas is progressing.
Logistics
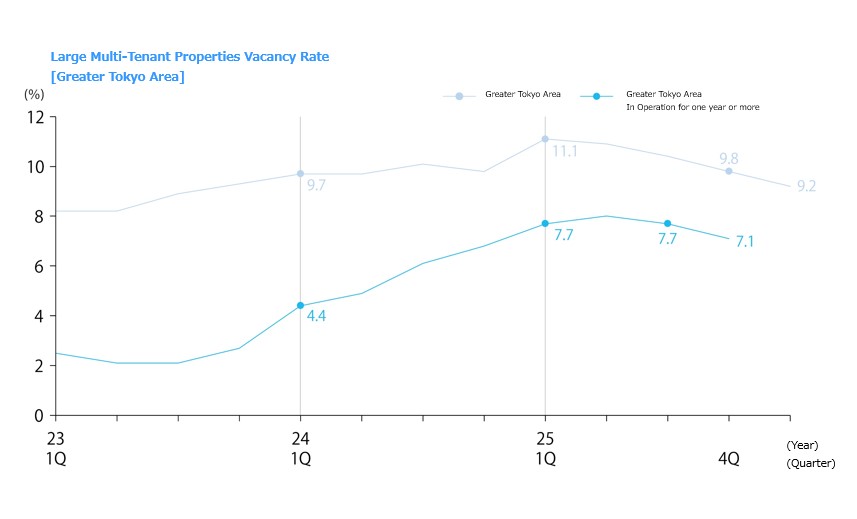
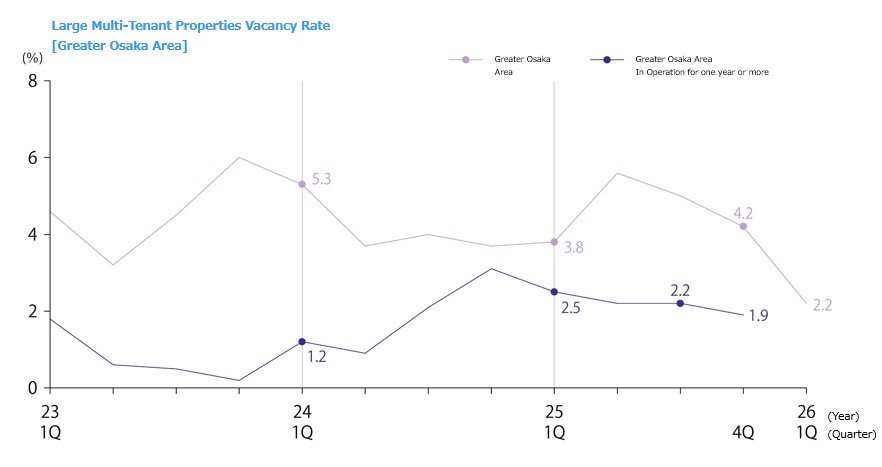
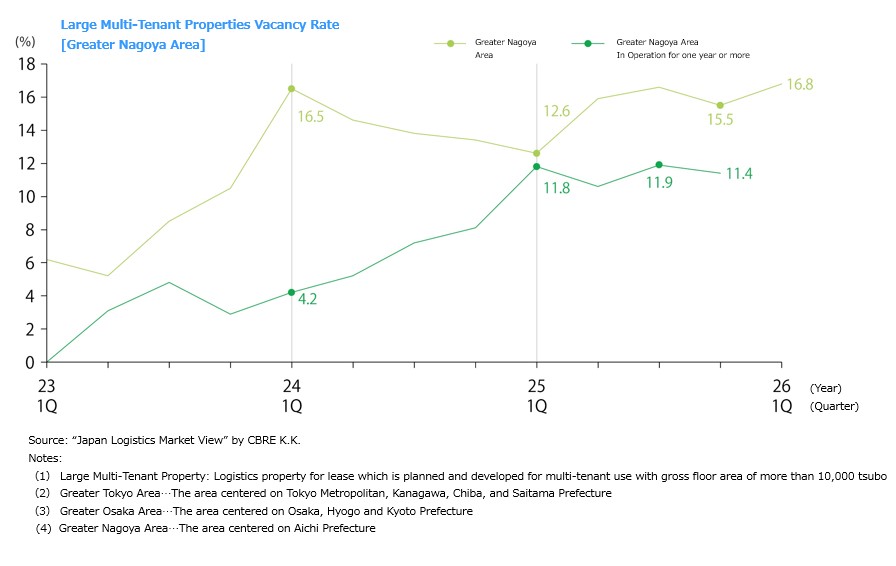
In the Tokyo Bay Area and Gaikan Expressway Area of the Greater Tokyo Area, and in the Kinki region, high occupancy is maintained with vacancy rates below 5%. In 2026, supply is abundant at 530,000 tsubo in the Greater Tokyo Area and 180,000 tsubo in the Kinki region, but demand is firm.
■ Conditions in the Greater Tokyo Area by Area in 2026 1Q
• The vacancy rate for large multi-tenant logistics facilities (LMT) in 2026 1Q was 9.2% (-0.6 percentage points quarter-on-quarter).
• The occupancy rate at completion for the eight newly supplied buildings totaling 137,000 tsubo in the current quarter did not reach 40%, but in existing properties, contracts were seen from daily necessities and apparel tenants. New demand was 168,000 tsubo.
• Demand is being stimulated across a wide range of areas by relocation demand due to the aging of facilities and the sense that rents will rise further because of increasing prices. Leasing of properties scheduled to be completed over the next six months to one year is also progressing, and a decline in vacancy rates is expected.
• The effective rent for the Greater Tokyo Area overall (per tsubo) was ¥4,530 (+0.9 percentage points quarter-on-quarter), and new supply planned through the end of 2026 is approximately 530,000 tsubo. Supply of 200,000 tsubo is scheduled for 3Q, and it is expected to exceed 2025.
• The vacancy rates and effective rents (per tsubo) by area are as follows:
• Tokyo Bay Area: 4.1% (+0.1 percentage points quarter-on-quarter) and ¥8,060 (+4.3% quarter-on-quarter). There are many inquiries for cases of rent increase revisions and high-spec, high-priced properties, and significant rent increases are being seen.
• Gaikan Expressway Area: 3.6% (-0.8 percentage points quarter-on-quarter) and ¥5,450 (+1.5% quarter-on-quarter). Of the two newly supplied buildings, one was completed fully occupied. In existing properties, leasing has progressed in relatively new properties, and the vacancy rate is favorable in the 3% range.
• National Route 16 Area: 8.9% (-0.6 percentage points quarter-on-quarter) and ¥4,560 (+0.2% quarter-on-quarter). Newly supplied properties in inland Chiba Prefecture were completed with vacancies remaining, but vacancies are being absorbed at several properties in Kanagawa Prefecture.
• Ken-O Expressway Area: 14.1% (-0.9 percentage points quarter-on-quarter) and ¥3,520 (+1.1% quarter-on-quarter). New supply consisted of three buildings. Two were completed with vacancies remaining. In existing properties, vacancies are being absorbed because of a sense of relatively low rents.
■ Conditions in Each Region in 2026 1Q
• Vacancy rates and effective rents (per tsubo) in each region are as follows:
• Kinki Region: 2.2% (-1.5 percentage points quarter-on-quarter) and ¥4,350 (+1.2% quarter-on-quarter). All three newly supplied buildings were completed fully occupied, and vacant space in existing properties has also been steadily absorbed. New demand of 108,000 tsubo in the current quarter was the third-highest level on a quarterly basis.
• At locations with excellent transportation access and employment potential, or locations close to urban areas, upward pressure on rents is strengthening.
• New supply planned through the end of 2026 is approximately 180,000 tsubo. Although there will be many areas with little past supply, the pre-commitment rate has progressed to around 50%.
• Chubu Region: 16.8% (+1.3 percentage points quarter-on-quarter) and ¥3,740 (+0.3% quarter-on-quarter). Two newly supplied buildings were completed with vacancies remaining, but vacancies in existing properties are being absorbed. In addition to conventional manufacturing industries, contracts were seen from a wide range of industries such as food, apparel, housing equipment, and pharmaceuticals.
• New supply planned through the end of 2026 is limited to around 70,000 tsubo, and because there are no plans for the second half of the year, there will be no receiving capacity for new demand, and a stronger sense of scarcity is expected.
• Fukuoka Region: 8.3% (+2.7 percentage points quarter-on-quarter) and ¥3,570 (flat quarter-on-quarter). Tenant activity is generally sluggish, and the one newly supplied building in the current quarter was completed with a large amount of vacancy remaining.
• New supply planned through the end of 2026 is approximately 100,000 tsubo. From 2Q onward, seven buildings totaling 81,000 tsubo are scheduled to be completed, and the vacancy rate is expected to rise.
■ Future Forecast
• In the Greater Tokyo Area and Fukuoka Region, supply will exceed 2025 levels. In the Fukuoka Region, supply is expected to exceed demand again in 2026, and vacancy rates are expected to rise. On the other hand, in the Greater Tokyo Area, demand is strong, and vacancy rates are expected to decline gradually; however, a sense of scarcity is expected to emerge, and rent increases are expected to continue.
• In the Kinki Region and Chubu Region, new supply is lower than in 2025. In the Kinki Region, since 2025 3Q, demand has continued to exceed supply, and vacancy rates are expected to decline while rents are expected to rise due to a sense of scarcity.
J-Reit
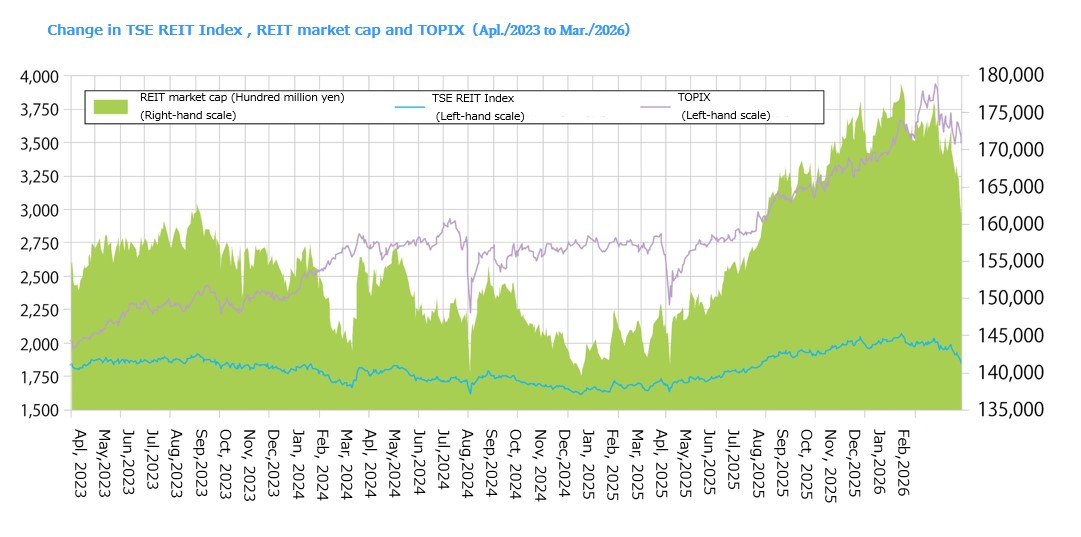
From the high level at the beginning of the year, the market has been on a downward trend due to the situation in the Middle East, while acquisitions of large-scale hotels and offices have increased the balance of assets under management.
■ J-REIT Market Conditions
• At the end of March 2026, the TSE REIT Index was 1,848.45 points, down 8.20% from the end of the previous year, and the total market capitalization of all REITs was ¥16.0918 trillion, down 7.64% from the same point. At the beginning of the year, the yen weakened against the background of the policies of the second Takaichi administration and the stock market rose sharply. The TSE REIT Index also rose, reaching 2,067.93 points on January 16, the highest level in four years since the beginning of 2022.
• However, due to risks to the economy such as higher crude oil prices caused by the military conflict between the United States and Iran, long-term interest rates reaching their highest level in 27 years, and the impact of profit-taking by institutional investors at the fiscal year-end, the market entered a downward trend from the end of February through March.
• The total balance of assets under management for all REITs was ¥24.5391 trillion at the end of March, an increase of ¥406.1 billion from the end of the previous year. On a quarterly basis, the amount of asset increase was the largest since June 2019 and the largest scale after COVID-19. As the background, investment unit market conditions improved from last year, the number of issues with NAV multiples (price-to-net-asset-value ratio reflecting real estate market value appraisals) above 1.0 increased, and an environment in which capital increases were easier was established. As a result, in 2026 1Q (January to March), eight issues announced public offerings.
• Japan Hotel REIT Investment Corporation acquired the Hyatt Regency Tokyo for ¥126.0 billion, the largest-scale hotel held by a REIT, and other acquisitions of large-scale hotels and offices contributed.
■Future Trends
• Market rents are rising mainly for offices and residences in central Tokyo, and REIT rental income is increasing. On the other hand, borrowing costs are also increasing with rising interest rates. Therefore, going forward, differences among issues are expected to widen depending on the degree of inflation sensitivity of portfolios and measures to address the risk of rising interest rates.
• Among diversified REITs, portfolio restructuring is progressing, including increasing the investment ratio of hotels, which have the highest inflation sensitivity, and indicating policies to newly incorporate hotels.
• Meanwhile, logistics facilities and suburban commercial facilities, which have high income stability under fixed rents, are shifting to operations that enhance income growth potential by changing rent formats to CPI-linked rents and shortening lease contract periods. In addition, as real estate prices continue to soar, movements are being seen to strategically replace properties and distribute sale gains and retain internal reserves.