Our Site uses cookies to improve your experience on our website. For more details, please read our Cookie Policy.
By closing this message or starting to navigate on this website, you agree to our use of cookies.
Our Site uses cookies to improve your experience on our website. For more details, please read our Cookie Policy.
By closing this message or starting to navigate on this website, you agree to our use of cookies.
This page is translated using machine translation. Please note that the content may not be 100% accurate.


Contact
Mitsui Fudosan Realty can provide a wide range of real estate services on both investment and residential properties.
Please feel free to give us a call or contact with mail inquiry.
Phone(English Line)
Contact Information by Region
- China400-120-1319
- HongKong800-93-3060
- Taiwan00801-81-2728
- Japan(English)0120-923-431
- Other Regions+81-3-6758-4072
This page is translated using machine translation. Please note that the content may not be 100% accurate.

Investment Real Estate Market Report | 2Q FY 2021

Foreword
Thank you very much for your continued support and business.
We, at Mitsui Fudosan Realty, have been providing a broad range of services in order for our valued clients to make the "Best Use" of precious assets, and attentive consultation about concerns and worries clients have with respect to assets in various conditions, not only through brokerage of business and investment properties but also by helping clients to utilize assets effectively for such purposes as estate and tax planning.
As part of these efforts, we prepare an "Investment Real Estate Market Report" for reference to help clients grasp the situation affecting real estate holdings. Since the investment real estate market is susceptible to external factors such as economic trends, an objective point of view is essential to understand the current market conditions. It is our great pleasure if this report is instrumental for readers to develop asset building strategies.
We will continue striving to deliver long-term support through development, implementation, and follow-up of plans that will satisfy clients, meet demands of each client on a "one to one" basis by making the most of professional expertise and experience gained over the years, and prove worthy of clients' trust.
Please feel free to contact us at the office below with any comments or requests concerning this report, or any matters related to real estate assets.
We look forward to opportunities to serve you soon.
Mitsui Fudosan Realty Co., Ltd.
Solution Business Division
■Toll-free Number: 0120-321-376
■Hours: 9:30 am - 6:00 pm Closed Saturdays, Sundays, and holidays
■3-2-5, Kasumigaseki, Chiyoda-ku, Tokyo 100-6019, Japan
We, at Solution Business Division of Mitsui Fudosan Realty Co., Ltd., have been producing a "Investment Real Estate Market Report" to serve as an aid to hopefully assisting our valued clients formulate a medium-to long term asset building plan.
Please also take a look at our website, which is full of useful information such as properties for sale, various consultation services, and articles by real estate experts.
Areas subject to collection of data
Tokyo Central submarket: Minato-ku, Chiyoda-ku, Chuo-ku, Shibuya-ku, Shinjuku-ku, and Bunkyo-ku
Tokyo South submarket: Shinagawa-ku, Meguro-ku, Setagaya-ku, and Ota-ku
Tokyo North / West submarket: Suginami-ku, Nakano-ku, Nerima-ku, Toshima-ku, Itabashi-ku, Kita-ku, and Taito-ku
Tokyo East submarket: Koto-ku, Sumida-ku, Arakawa-ku, Edogawa-ku, Katsushika-ku, and Adachi-ku
Yokohama / Kawasaki region: Yokohama city and Kawasaki city
Detailed descriptions
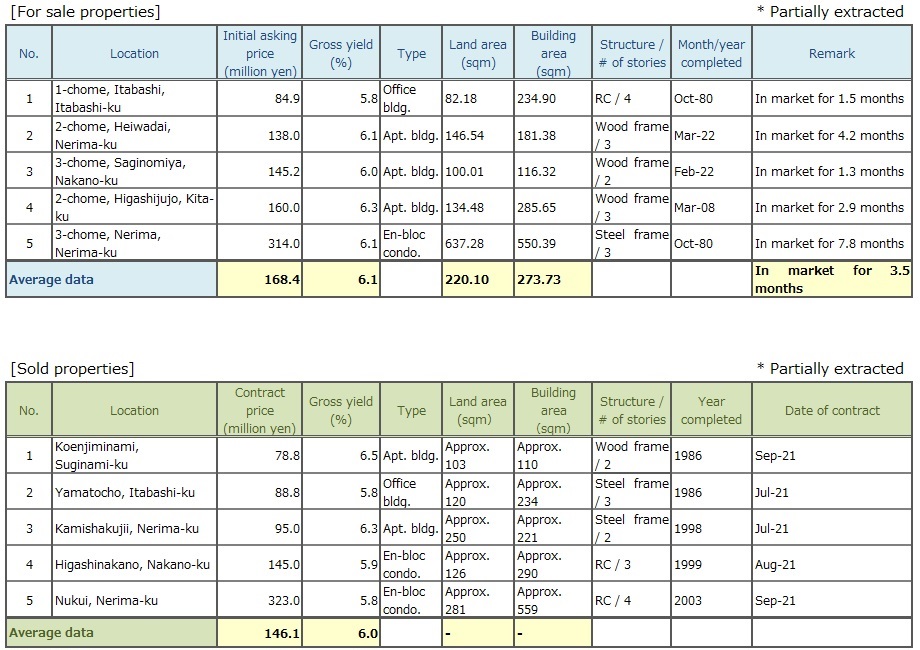
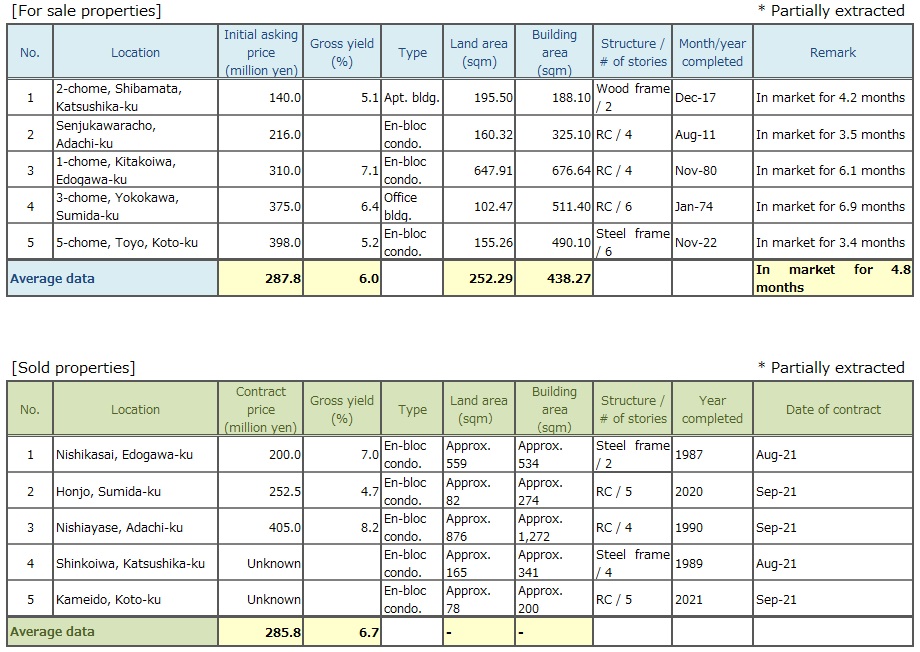
Pick Up Area: For investment real estate, trends in the average gross yields on contract price and initial asking price, together with the number of closed contracts by submarkets are represented in the graph. The details of the transition of actual market value and properties both for sale and sold in certain neighborhoods are also shown.
Market Overview: As an overview of all the submarkets, the trend from the past to this quarter is available. Trends in the average gross yields based on contract price and initial asking price together with the number of closed contracts by area are shown for comparison.
Data Source: Information is extracted from the database containing properties offered for sale and contracts concluded through Mitsui Fudosan Realty Network (En-bloc condominiums / office buildings / apartment buildings).
- Number of Transactions & Average Gross Yield on Contract Price: Number of contracts closed in a quarter (three months) and average gross yield of them (including estimated values)
- Average Gross Yield on Initial Asking Price: Quarterly average gross yield of closed contracts based on their asking price initially quoted
*Figures in each chart represent indices based on values for 1Q / FY2012 set at 100.
(Average Gross Yield on Contract Price is shown as an index to Average Gross Yield on Initial Asking Price for 1Q / FY 2012 set at 100.)
[Note] The historical data may be revised subsequently due to maintenance carried out from time to time, such as adding newly acquired data.
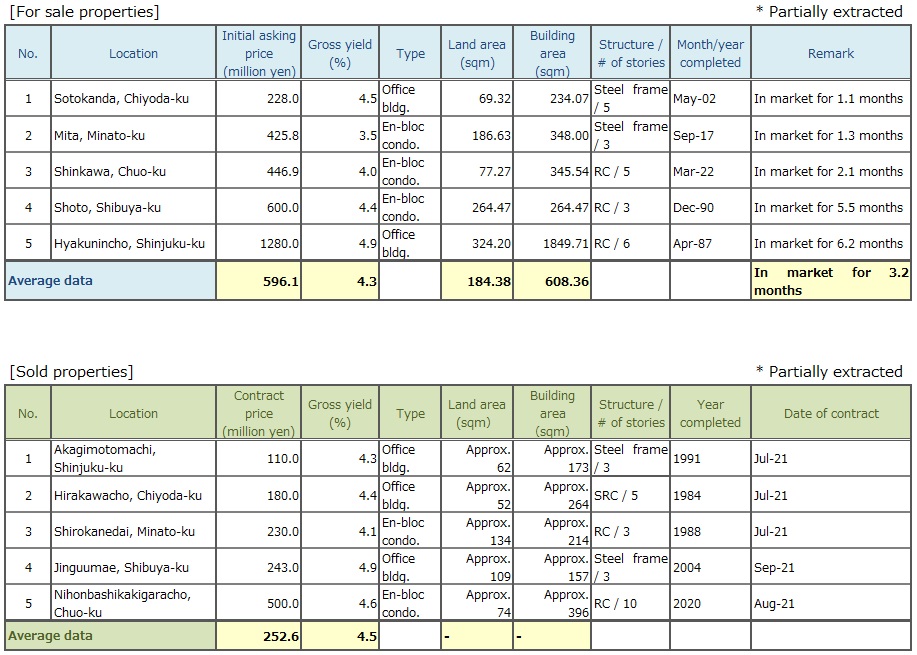
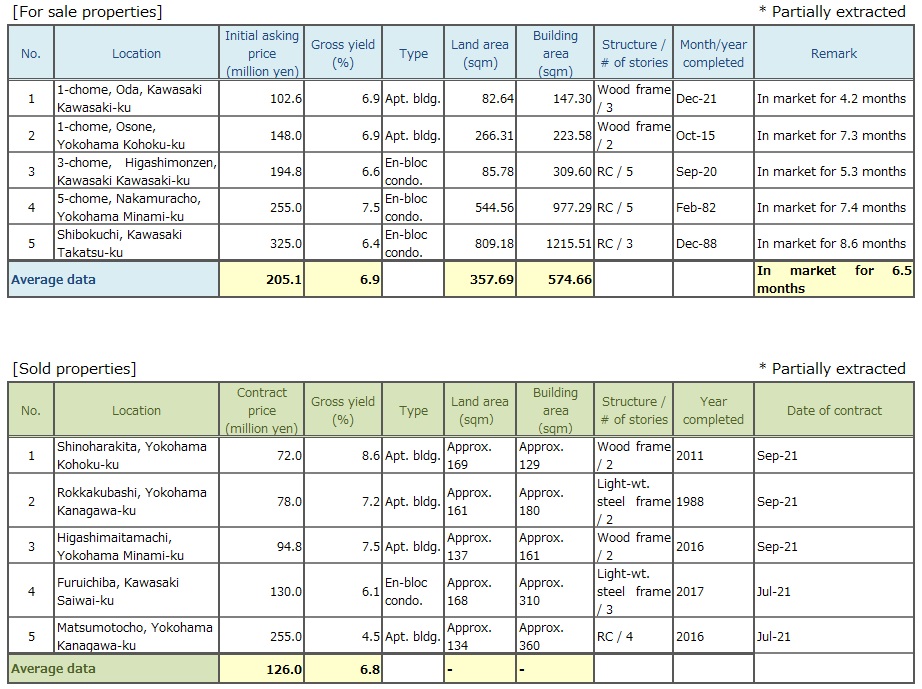
Pick Up Area -Tokyo Central submarket-
(*)Tokyo Central submarket: Minato-ku, Chiyoda-ku, Chuo-ku, Shibuya-ku, Shinjuku-ku, and Bunkyo-ku
◆Movements by Quarter: Average Gross Yield on Contract Price / Average Gross Yield on Initial Asking Price / Number of Transactions
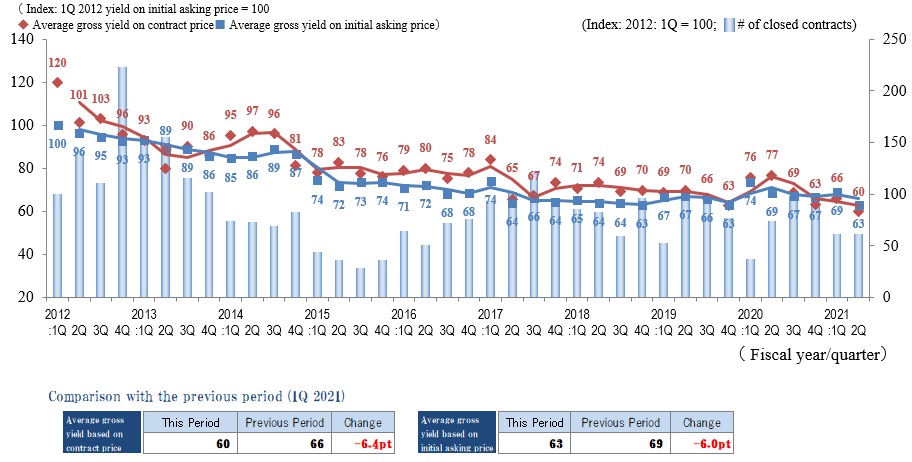
◆Brokered Transactions of Investment Real Estate in the Submarket
The number of transactions in 2Q / FY2021 was well below that of 2Q / FY2019. As for yields, index of Average Gross Yield on Initial Asking Price and Average Gross Yield on Contract Price shrank by 6.0 pt. and 6.4 pt. respectively from the previous quarter.
With the Average Gross Yield on Contract Price staying lower than the Average Gross Yield on Initial Asking Price, both yields showed a downward trend again after a slight increase in 1Q. Now the index of the Average Gross Yield on Contract Price came down to 60, proving that Tokyo Central submarket continued to be strong and remained as a "seller's market." Real estate companies and offshore investment funds, still having a hearty appetite and pursuing a limited number of prime properties for sale, tended to make deals at high prices, which in turn pushed up the price level of overall market.
Though there was a slight increase in the number of properties available for sale while the COVID-19 contagion subsided, the transaction volume diminished YoY. Investors seemed to be becoming more fastidious in the choice of properties to buy. Contract prices of prime properties in the Central submarket may escalate still, but the disparity in yields on contract prices will probably widen from property to property.
Tokyo Central submarket was found to be still strong by survey this time. But it will be prudent to keep paying close attention to the market conditions in and after 3Q, since the Central submarket is particularly sensitive to changes in the economy and other factors and can be affected by them.
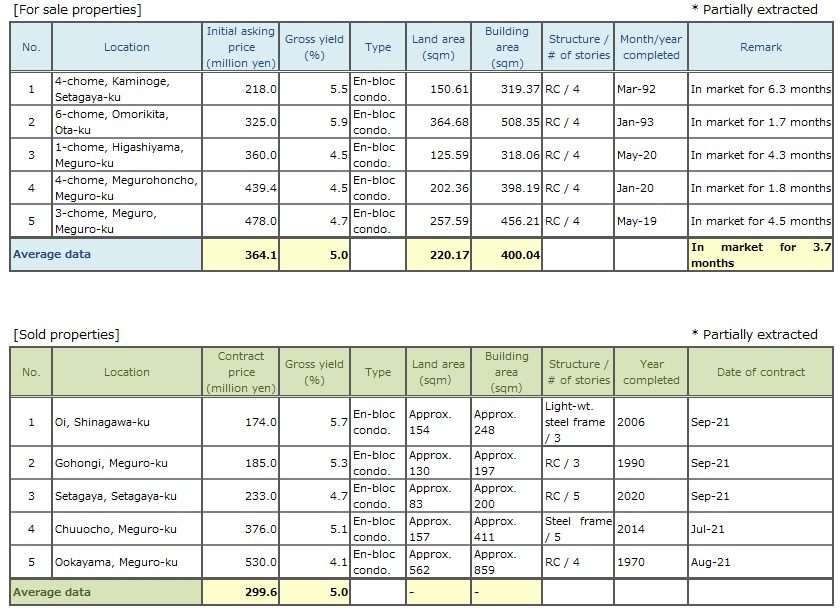
Pick Up Area -Tokyo South submarket-
(*) Tokyo South submarket: Shinagawa-ku, Meguro-ku, Setagaya-ku, and Ota-ku
◆Movements by Quarter: Average Gross Yield on Contract Price / Average Gross Yield on Initial Asking Price / Number of Transactions
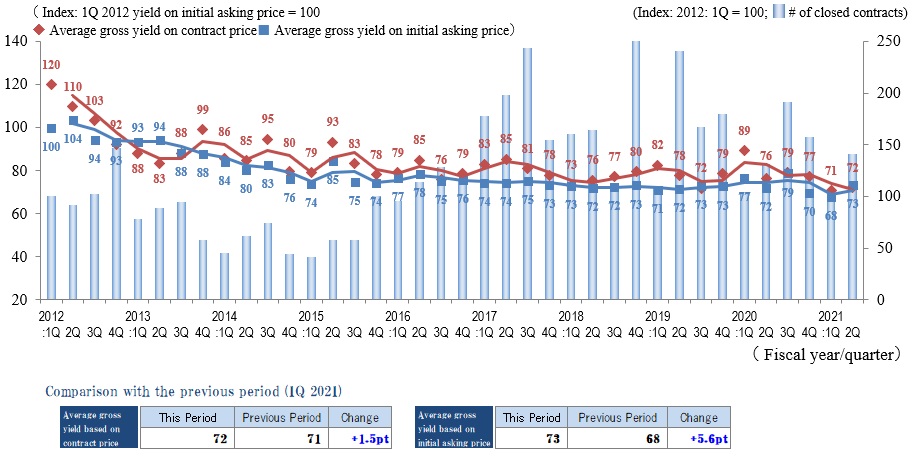
◆Brokered Transactions of Investment Real Estate in the Submarket
In 2Q / FY2021, index of Average Gross Yield on Contract Price in this submarket was up by 1.5 pt. from the previous quarter (1Q / FY2021) to 72, showing no marked fluctuations. On the other hand, the index of Average Gross Yield on Initial Asking Price jumped by 5.6 pt. from the previous quarter to 73 (prices declined). As for number of transactions, it climbed by roughly 40% QoQ, recovering somehow from a significant drop in the previous quarter. There were a few reasons why the transaction volume grew. Firstly, there was an increase in number of properties coming on to the market. Secondly, the gap narrowed between investor's expected rate of return and yields on asking price, which went up due to sellers' adjustment of asking prices downward, resulting in more opportunities for deals being struck.
Index of Average Gross Yield on Initial Asking Price in this submarket has been, for the most part, hovering in 70's since 2015. Unless there is a drastic change in a market environment in the future such as major fluctuations in rent levels and a surge in the supply of new developments, yields will stay on the same level in this submarket. However, it is necessary to keep a close eye on the number of properties coming on to the market and the movement of a yield level.
Pick Up Area -Tokyo North / West submarket-
(*) Tokyo North / West submarket: Suginami-ku, Nakano-ku, Nerima-ku, Toshima-ku, Itabashi-ku, Kita-ku, and Taito-ku
◆Movements by Quarter: Average Gross Yield on Contract Price / Average Gross Yield on Initial Asking Price / Number of Transactions
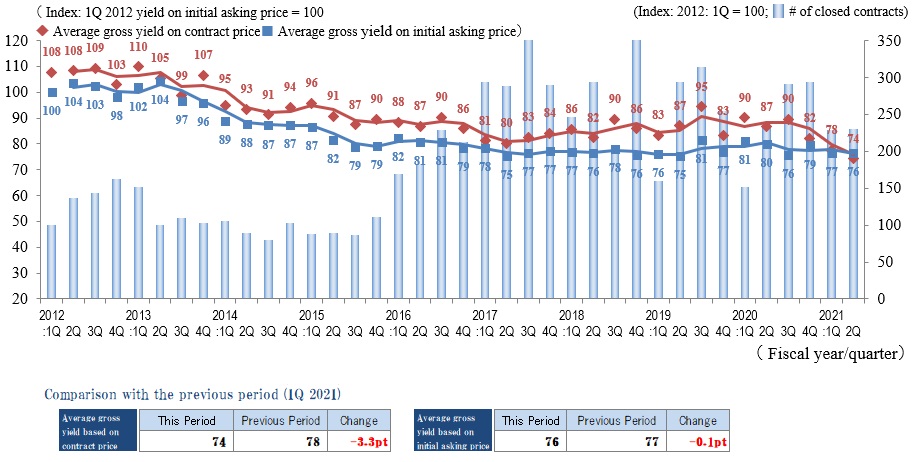
◆Brokered Transactions of Investment Real Estate in the Submarket
In Tokyo North / West submarket, there was little change in number of transactions in 2Q / FY2021 from the previous quarter. Index of Average Gross Yield on Contract Price came down (by 3.3 pt. QoQ) to 74 (price increased), and Index of Average Gross Yield on Initial Asking Price slightly dropped (by 0.1 pt. QoQ) to 76. The Indices of Average Gross Yield on Contract Price and Average Gross Yield on Initial Asking Price were inverted for the first time in this quarter since the start of this survey in 2012 with the former falling below the latter by 2 pt. The investment real estate market in Tokyo North / West submarket can be said to be very strong this quarter as well as the previous quarter.
Now that the worrisome spread of COVID-19 contagion has subsided, lifting of the state of emergency on September 30 has led to the relaxation of restrictions on social and economic activities, providing a boost to the already robust investment real estate market.
As mentioned earlier, it is currently a "seller's market." If yields continue to fall or prices continue to rise, however, there is concern that the number of transactions may be held down. It will be important from now on to closely monitor the market trend by carefully watching the number of properties coming on to the market and the level of gross yield on asking price.
Pick Up Area -Tokyo East submarket-
(*) Tokyo East submarket: Koto-ku, Sumida-ku, Arakawa-ku, Edogawa-Ku, Katsushika-ku, and Adachi-ku
◆Movements by Quarter: Average Gross Yield on Contract Price / Average Gross Yield on Initial Asking Price / Number of Transactions
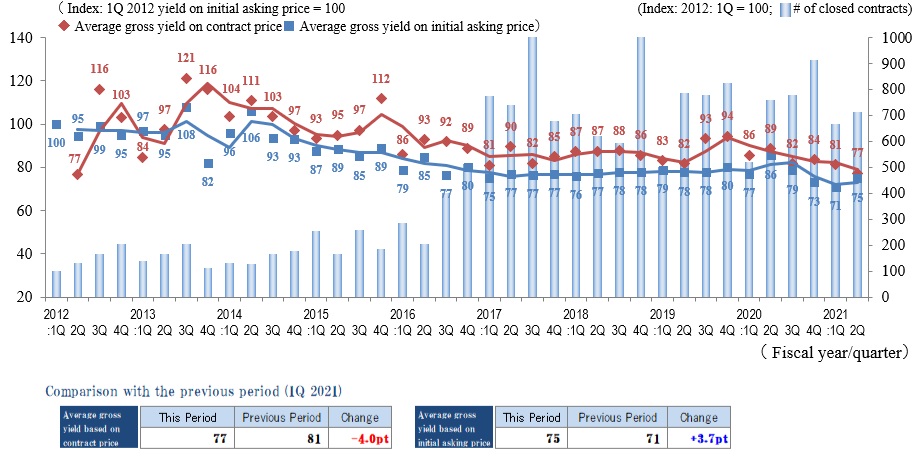
◆Brokered Transactions of Investment Real Estate in the Submarket
Number of transactions in Tokyo East submarket in 2Q / FY2021 ended up with a slight decrease YoY. Index of Average Gross Yield on Initial Asking Price was 75 (up 3.7 pt. QoQ), while index of Average Gross Yield on Contract Price was 77 (down 4.0 pt. QoQ), the latter being the lowest record ever since the start of this survey in 2012. Contract prices rose in this "post-Olympics" market of 2Q / FY2021, evidencing the favorable state of the real estate market in eastern Tokyo.
Also in this submarket, the impact of COVID-19 was transitory and confined, and desirable properties such as properties close to a station, large in scale, or highly visible being located on a main street of a town, would supposedly command "higher prices." As for properties distant from a station or outdated, on the other hand, it would take longer than ever before to be sold. So the market has been polarized even more distinctly.
Studios and one-bedroom units for single occupancy households are now becoming oversupplied, and there are cases where a leasing period is prolonged and rents needs to be reconsidered. It will be necessary to keep an eye on the trend in the single-occupancy rental market and see how it can impact the real estate market as a whole in eastern Tokyo.
Pick Up Area -Yokohama / Kawasaki region-
(*) Yokohama and Kawasaki region: Yokohama city, Kawasaki city
◆Movements by Quarter: Average Gross Yield on Contract Price / Average Gross Yield on Initial Asking Price / Number of Transactions
◆Brokered Transactions of Investment Real Estate in the Submarket
Number of transactions in Yokohama / Kawasaki region was slightly lower both QoQ and YoY in 2Q / FY2021, and a highly active period in terms of transaction volume since 2H / 2020 came to an end for the moment.
Indices of Average Gross Yield on both Contract Price and Initial Asking Price fell slightly from the previous quarter (price increased), on the other hand. So it would be appropriate to say the investment real estate market here is still thriving.
Though there were an increasing number of cases where properties of lesser physical quality changed hands at yields exceeding 10% since last year, such cases were seldom observed this quarter. Inventory of properties unsold for a long time, however, is growing, and the situation of market polarization remain unchanged.
As far as the demand-supply condition is concerned, there continues a brisk demand to buy due to "strong inflow of investment money," while the number of properties coming on to the market remained small. It is presumed that this mismatch between demand and supply has led to a slight decrease in the number of transactions this quarter.
As the number of newly infected persons has plummeted, the state of emergency has been lifted, and the request for self-restraint by bars and restaurants has been withdrawn, there are significant improvements in market environment. On the other hand, there are still many uncertain elements in the real economy, such as rising costs of natural resources and a prospect for U.S. interest rate hikes. So it is necessary to pay close attention to such economic conditions.
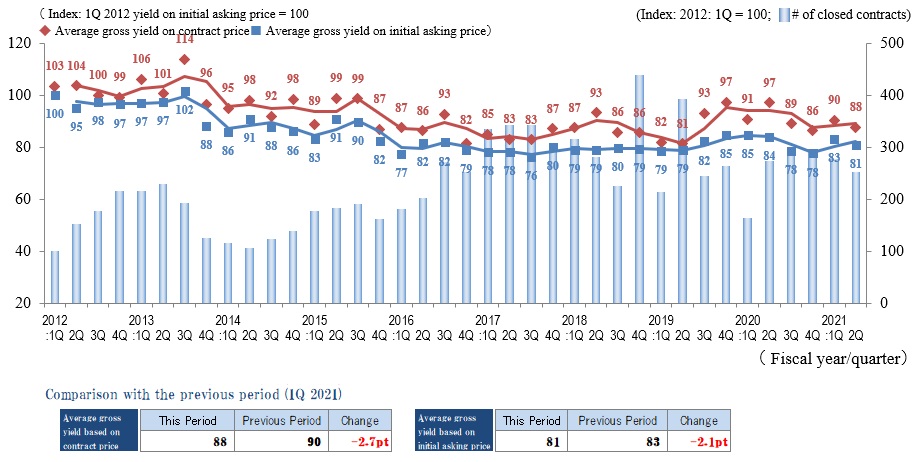
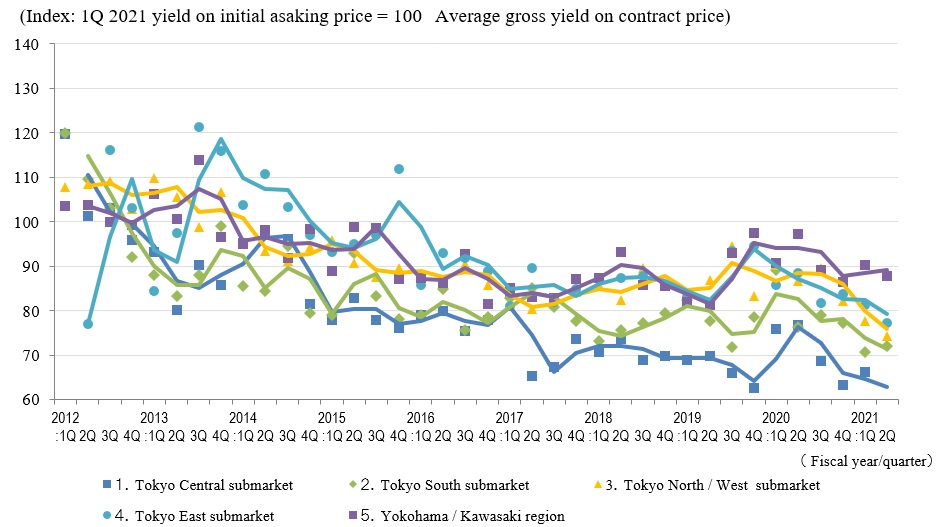
General overview
◆Movements by Quarter: Average Gross Yield on Contract Price / Average Gross Yield on Initial Asking Price / Number of Transactions for the 5 Areas
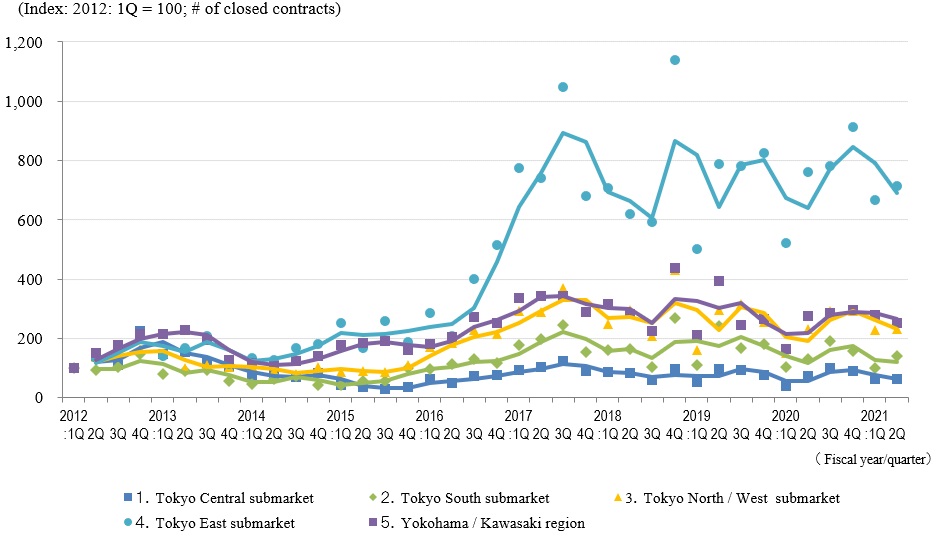
◆Movements in Number of Transactions by Area
◆Movements in Average Gross Yield on Contract Price by Area
◆Movements in Average Gross Yield on Initial Asking Price by Area
Though overall number of transactions during this quarter grew QoQ, it was still smaller than the same period a year ago or two years ago, providing evidence for a limited supply of properties for sale in the market.
Indices of Average Gross Yield on Contract Price fell (price rose) in all the areas except for Tokyo South submarket. Index of Average Gross Yield on Contract Price went up by 1.5 pt. QoQ (price fell) in Tokyo South submarket. Its Index of Average Gross Yield on Contract Price in the previous quarter was the lowest record since the start of this survey and even lower than that of Tokyo Central submarket. Therefore, Tokyo South submarket can be judged to be buoyant still.
In addition, index of Average Gross Yield on Contract Price fell below that of Average Gross Yield on Initial Asking Price not only in Tokyo Central submarket but also in Tokyo North / West submarket in this quarter, so the market still continued to favor sellers over buyers.
On the other hand, when attention is turned to the J-REIT market, which can be heavily impacted by money market, there are certain issues whose unit prices have been stumbling after public offerings, and wariness over future prospects of the office market and interest rate hike can be felt.
The stock market as of early November is booming after lower house election, supported by expectations for economic measures by the new administration and strong corporate sector's performance. However, because of uncertain outlook for economic situations home and abroad, such as rising oil prices, fall of the yen and an interest rate hike, it may be prudent to carefully examine real estate investment.